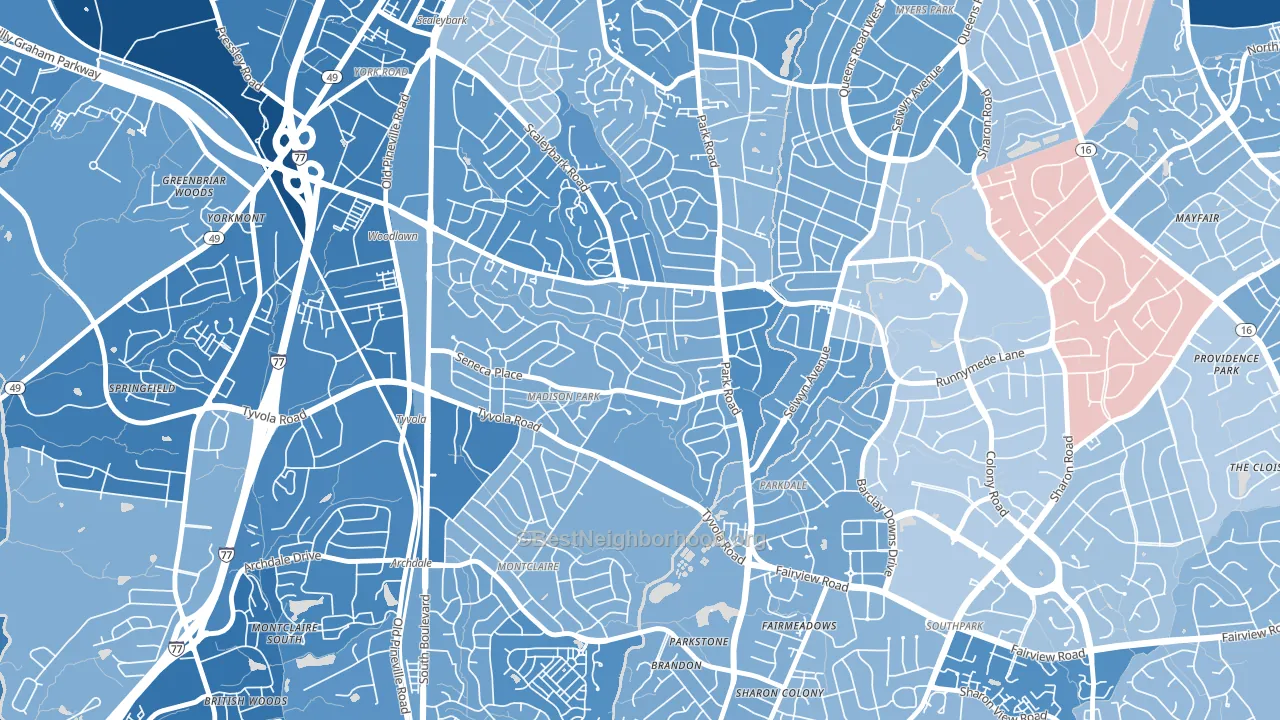
Madison Park leans Democratic by roughly 24 points: about 62% of voters vote Democratic and 38% Republican.
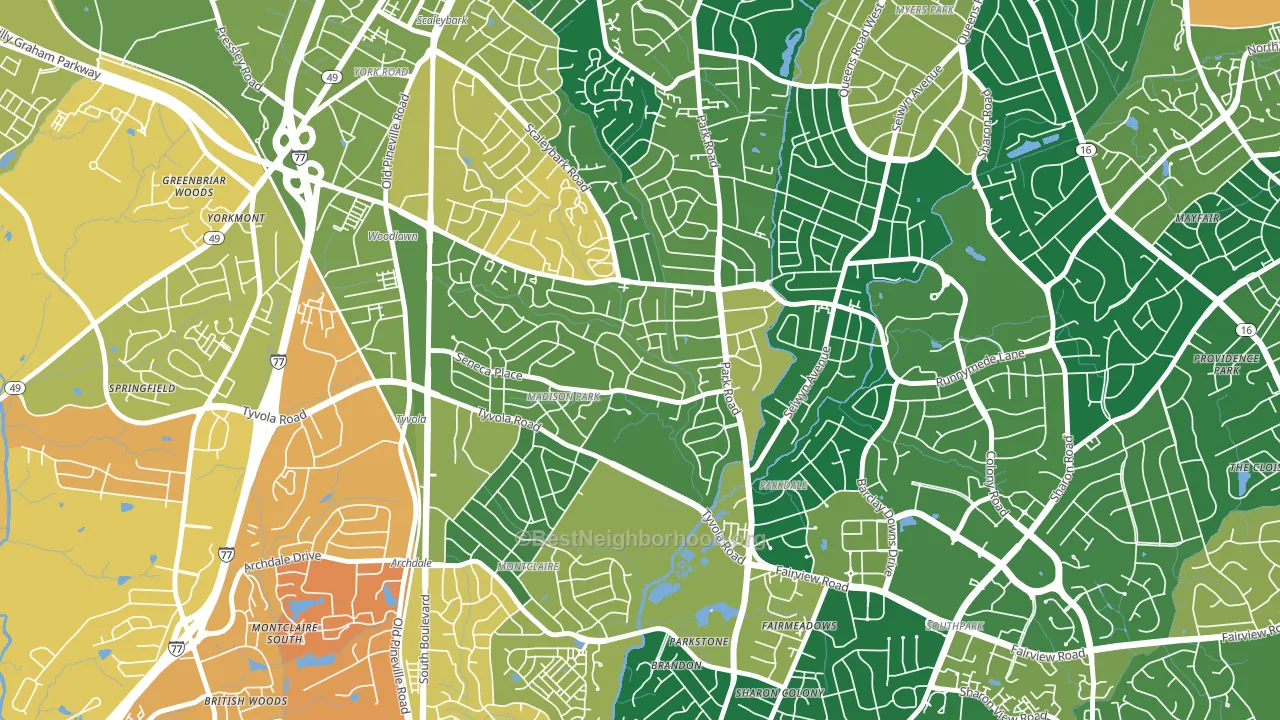
About 79% of adults in Madison Park typically vote, above the U.S. average of about 62%. Among adults in Madison Park, ~49% vote Democratic, ~30% Republican, and ~21% don't vote. The map below shows estimated turnout by block group.
How Madison Park compares
Among neighborhoods within 5 miles, Madison Park leans more Democratic than 13 of 35 neighbors.
Madison Park runs about 28 points more Democratic than North Carolina as a whole. North Carolina leans Republican overall, while Madison Park is one of the few Democratic-leaning pockets.
Politics vary noticeably by block within Madison Park. The east side is the most Democratic-leaning (D+30) and the west side is the least Democratic-leaning (D+20), a spread of about 10 points.
Why Madison Park leans the way it does
This analysis examined 14,881 data points per neighborhood to find what predicts political lean and turnout. The items below are a few correlations that stood out for Madison Park, not a ranked or complete list of what matters most.
Areas with high college attainment vote Democratic. About 73% of adults in Madison Park hold a bachelor's degree, about 45 points above the U.S. average of 28%. A high never-married share predicts Democratic voting, and about 52% of adults in Madison Park have never been married, above 85% of neighborhoods. Madison Park runs against the grain of North Carolina, a Democratic-leaning pocket in a Republican-leaning state.
Walkability and Democratic lean
Places with a highly walkable street grid tend to lean Democratic; Madison Park, Charlotte, NC sits in the top tenth nationally on this measure. A walkable street grid does not change how people vote; it mostly reflects how urban a place is.
Why turnout in Madison Park looks the way it does
Areas with high high-school completion turn out at higher rates. More than 99% of adults in Madison Park have completed high school, about 11 points above the North Carolina average of 88%. Learn more about the findings and methodology on the political spectrum map.
Nearby Neighborhoods
- Closeburn-Glenkirk, Charlotte, NC D+24
- Collingwood, Charlotte, NC D+36
- Ashbrook-Clawson Village, Charlotte, NC D+27
- Barclay Downs, Charlotte, NC D+14
- Starmount, Charlotte, NC D+32
- Myers Park, Charlotte, NC D+9
- Sedgefield, Charlotte, NC D+27
- Montclaire South, Charlotte, NC D+52
- Quail Hollow, Charlotte, NC D+15
- Beverly Woods, Charlotte, NC D+7
Neighborhoods with Similar Populations
- Waite Park, Minneapolis, MN D+55
- Berger, Dolton, IL D+82
- Memorial Square, Springfield, MA D+42
- Plum Orchard, New Orleans, LA D+84
- Burlingame Gate, Burlingame, CA D+56
- Ardmore, Winston-Salem, NC D+49
- South Valley, Syracuse, NY D+42
- Whitehouse, Jacksonville, FL R+34
- Kilbourn Town, Milwaukee, WI D+57
- Riverdale, Detroit, MI D+84
Sources and methodology
Precinct-level voting records used to fit the model come from North Carolina State Board of Elections, distributed by the Voting and Election Science Team. Demographic inputs come from the U.S. Census Bureau (ACS 5-year estimates and the 2020 Decennial Census). Health and environmental inputs come from the CDC (PLACES and the Environmental Justice Index). Land cover comes from the USGS and EPA. Election-day and lead-up weather come from PRISM 4km daily grids and the NOAA Global Historical Climatology Network. Mail-voting and election-administration patterns come from the MIT Election Lab's Survey of the Performance of American Elections. Block-group crime detail comes from CrimeGrade. Internet data and modeling support provided by ISPreports.org.
Modeling and analysis by the BestNeighborhood data science team. Full methodology and findings: political spectrum map.
Methodology reviewed by the BestNeighborhood data team. Last updated May 2026.