Robtown is a Republican stronghold. About 22% of voters here vote Democratic and 78% Republican.
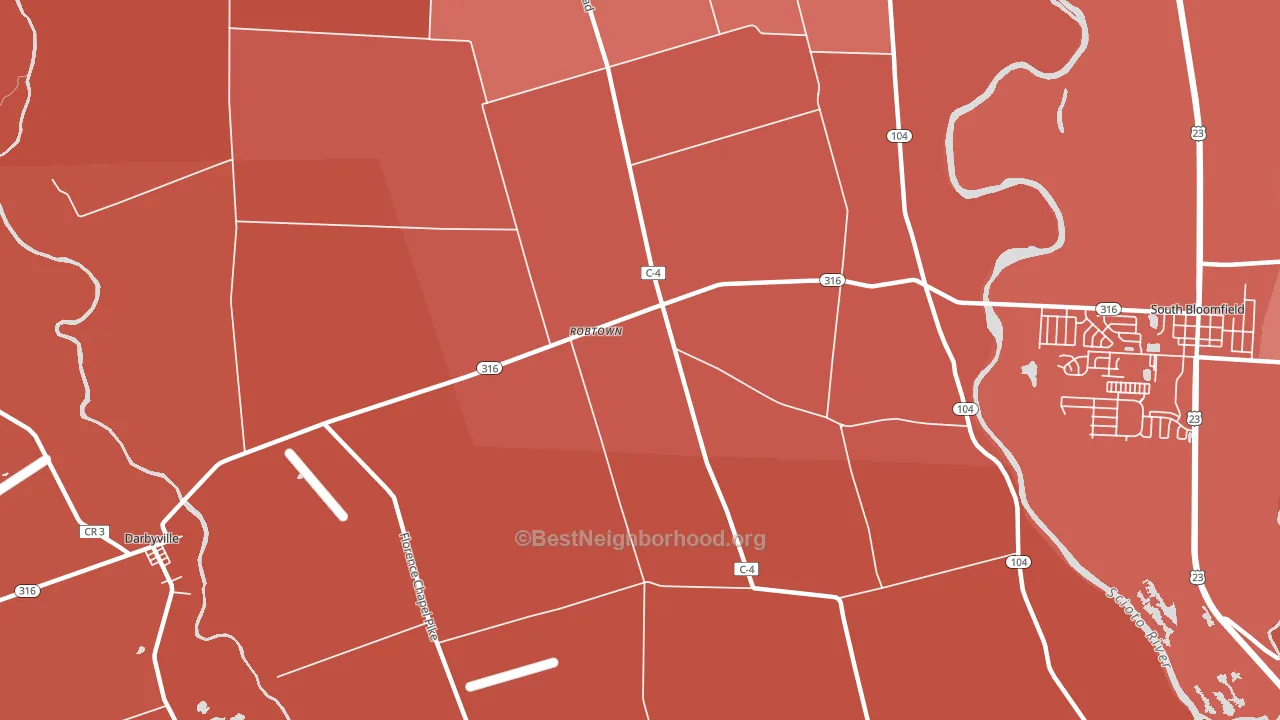
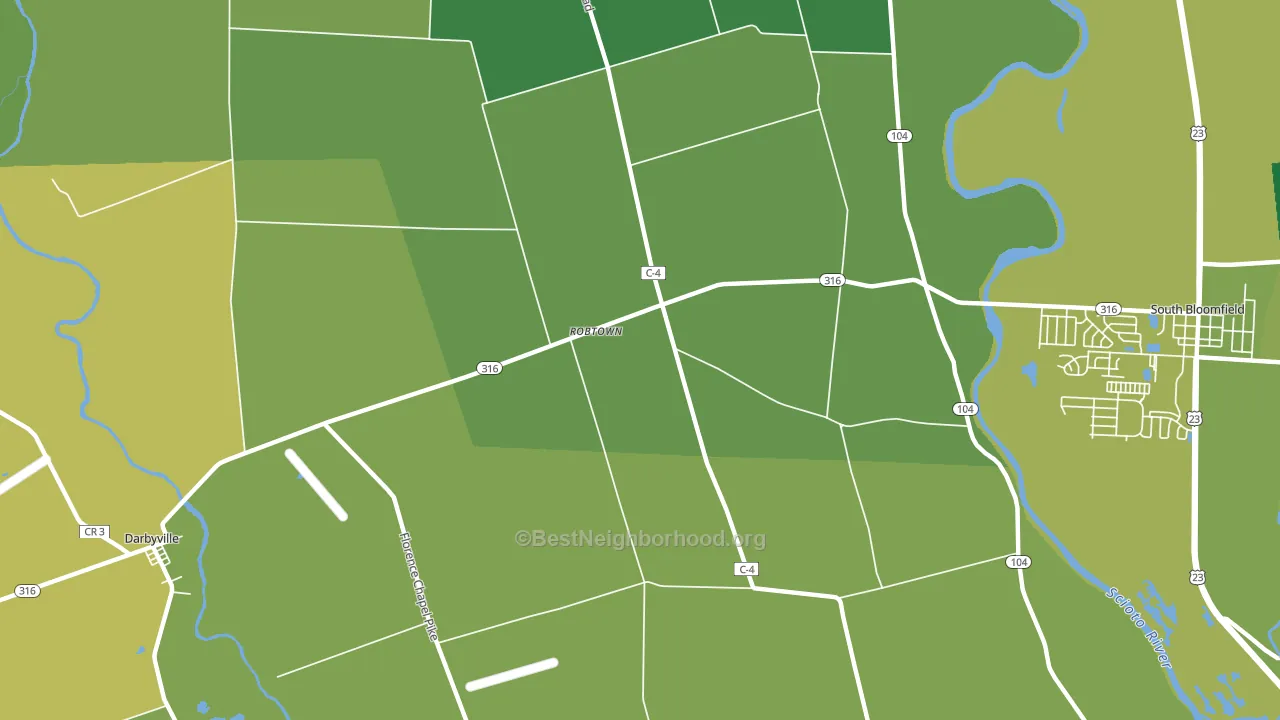
About 82% of adults in Robtown typically vote, above the U.S. average of about 62%. Among adults in Robtown, ~18% vote Democratic, ~64% Republican, and ~18% don't vote. The map below shows estimated turnout by block group.
How Robtown compares
Among cities within 25 miles, Robtown leans more Republican than 68 of 93 neighbors.
Robtown runs about 45 points more Republican than Ohio as a whole.
Why Robtown leans the way it does
This analysis examined 14,881 data points per city to find what predicts political lean and turnout. The items below are a few correlations that stood out for Robtown, not a ranked or complete list of what matters most.
Areas with many family households vote Republican. About 86% of households in Robtown are family households, about 20 points above the U.S. average of 67%.
Food insecurity and voter turnout
Places with low food insecurity tend to turn out at a higher rate; Robtown, OH sits in the bottom quarter nationally on this measure. Food insecurity does not directly drive turnout; it reflects economic hardship, which lines up with lower voting.
Why turnout in Robtown looks the way it does
Turnout in Robtown sits close to the national pattern. Learn more about the findings and methodology on the political spectrum map.
Nearby Cities
- South Bloomfield, OH R+49
- Darbyville, OH R+55
- Commercial Point, OH R+41
- Matville, OH R+46
- Fox, OH R+55
- Little Walnut, OH R+56
- Ashville, OH R+48
- Orient, OH R+26
- Five Points, OH R+55
- Grange Hall, OH R+55
Cities with Similar Populations
- Roxbury, VT Even
- Portsville, DE R+52
- Graceville, MN R+44
- Cisco, IL R+42
- Rappahannock Academy, VA R+15
- Sportsmen Acres, OK R+57
- Monroe, NH R+20
- Collettsville, NC R+63
- Neva Corners, WI R+50
- Crooked Oak, AL R+76
Sources and methodology
Precinct-level voting records used to fit the model come from Ohio Secretary of State, Elections, distributed by the Voting and Election Science Team. Demographic inputs come from the U.S. Census Bureau (ACS 5-year estimates and the 2020 Decennial Census). Health and environmental inputs come from the CDC (PLACES and the Environmental Justice Index). Land cover comes from the USGS and EPA. Election-day and lead-up weather come from PRISM 4km daily grids and the NOAA Global Historical Climatology Network. Mail-voting and election-administration patterns come from the MIT Election Lab's Survey of the Performance of American Elections. Block-group crime detail comes from CrimeGrade. Internet data and modeling support provided by ISPreports.org.
Modeling and analysis by the BestNeighborhood data science team. Full methodology and findings: political spectrum map.
Methodology reviewed by the BestNeighborhood data team. Last updated May 2026.