Rolling Prairie leans heavily Republican by roughly 40 points: about 30% of voters vote Democratic and 70% Republican.
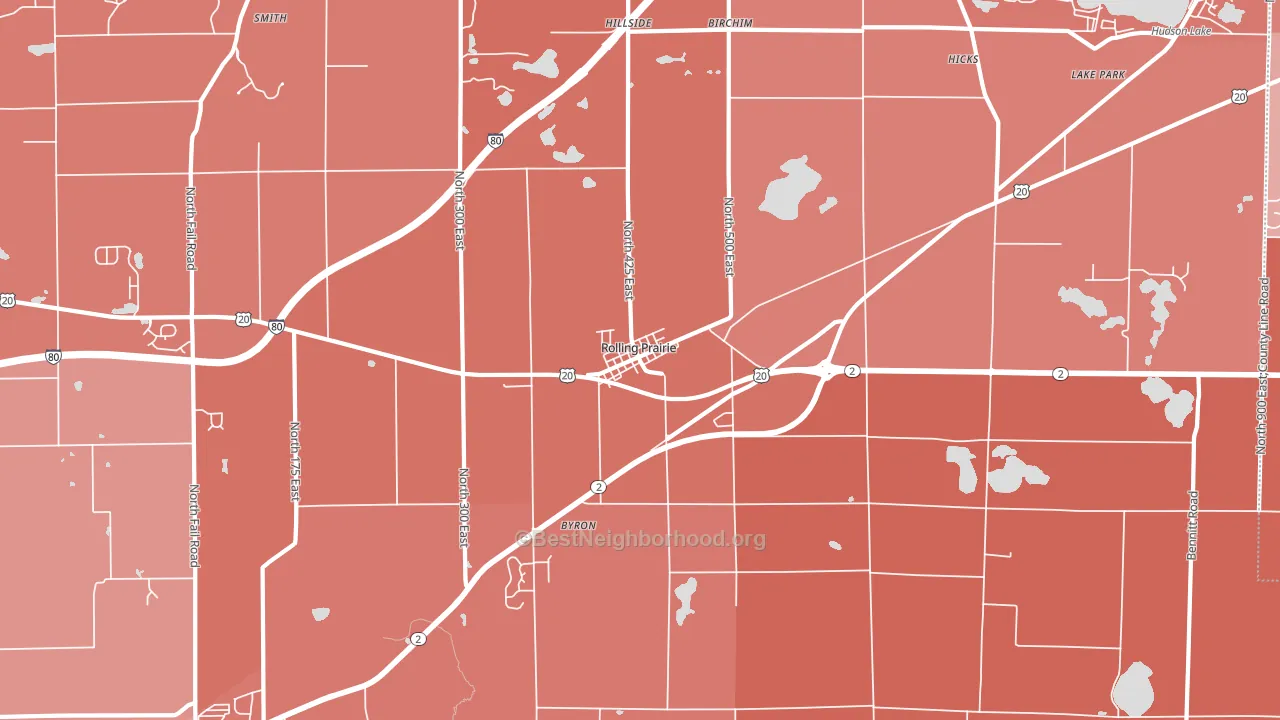
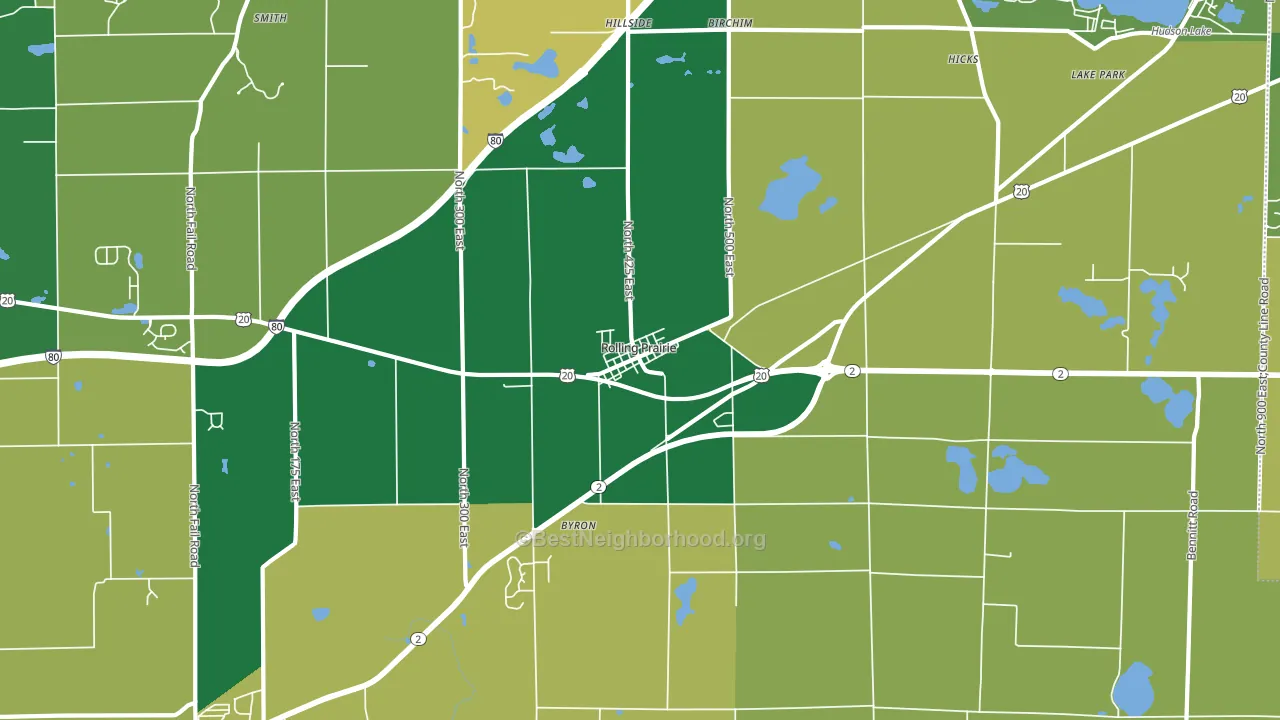
About 81% of adults in Rolling Prairie typically vote, above the U.S. average of about 62%. Among adults in Rolling Prairie, ~24% vote Democratic, ~57% Republican, and ~19% don't vote. The map below shows estimated turnout by block group.
How Rolling Prairie compares
Among cities within 25 miles, Rolling Prairie leans more Republican than 48 of 73 neighbors.
Rolling Prairie runs about 21 points more Republican than Indiana as a whole.
Why Rolling Prairie leans the way it does
This analysis examined 14,881 data points per city to find what predicts political lean and turnout. The items below are a few correlations that stood out for Rolling Prairie, not a ranked or complete list of what matters most.
Car-dependent areas vote Republican. About 93% of residents in Rolling Prairie drive to work alone, about 19 points above the U.S. average of 74%. A high family-household share predicts Republican voting, and about 75% of households in Rolling Prairie are family households, above 76% of cities.
Park access and Republican lean
Places with low park coverage tend to lean Republican; Rolling Prairie, IN sits below the national average on this measure. Park access does not change how people vote; it tends to track denser, higher-income areas.
Why turnout in Rolling Prairie looks the way it does
Homeowners vote more often than renters. About 92% of households in Rolling Prairie own their home, about 10 points above the Indiana average of 82%. Learn more about the findings and methodology on the political spectrum map.
Nearby Cities
- Lake Park, IN R+40
- Tee Lake, IN R+32
- Mill Creek, IN R+45
- New Carlisle, IN R+28
- Salem Heights, IN R+43
- La Porte, IN R+20
- Monroe Manor, IN R+11
- Stillwell, IN R+43
- Three Oaks, MI R+26
- Pinola, IN R+29
Cities with Similar Populations
- Cotuit, MA D+20
- Brownsboro, TX R+73
- Moores Hill, IN R+61
- Port Reading, NJ R+4
- Golf Manor, OH D+65
- Wellsville, KS R+45
- Ferrysburg, MI R+5
- Story City, IA R+12
- Mansfield, GA R+63
- Malakoff, TX R+48
Sources and methodology
Precinct-level voting records used to fit the model come from Indiana Secretary of State, Elections, distributed by the Voting and Election Science Team. Demographic inputs come from the U.S. Census Bureau (ACS 5-year estimates and the 2020 Decennial Census). Health and environmental inputs come from the CDC (PLACES and the Environmental Justice Index). Land cover comes from the USGS and EPA. Election-day and lead-up weather come from PRISM 4km daily grids and the NOAA Global Historical Climatology Network. Mail-voting and election-administration patterns come from the MIT Election Lab's Survey of the Performance of American Elections. Block-group crime detail comes from CrimeGrade. Internet data and modeling support provided by ISPreports.org.
Modeling and analysis by the BestNeighborhood data science team. Full methodology and findings: political spectrum map.
Methodology reviewed by the BestNeighborhood data team. Last updated May 2026.