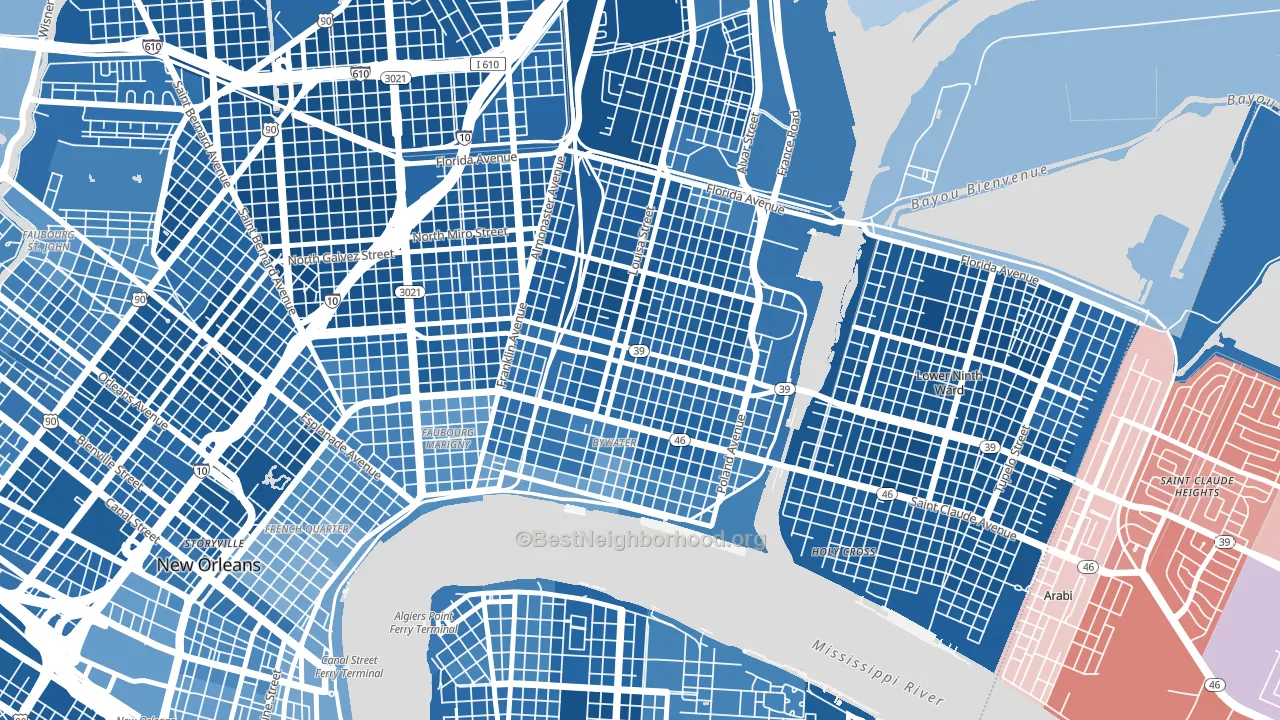
Saint Claude is a Democratic stronghold. About 85% of voters here vote Democratic and 15% Republican.
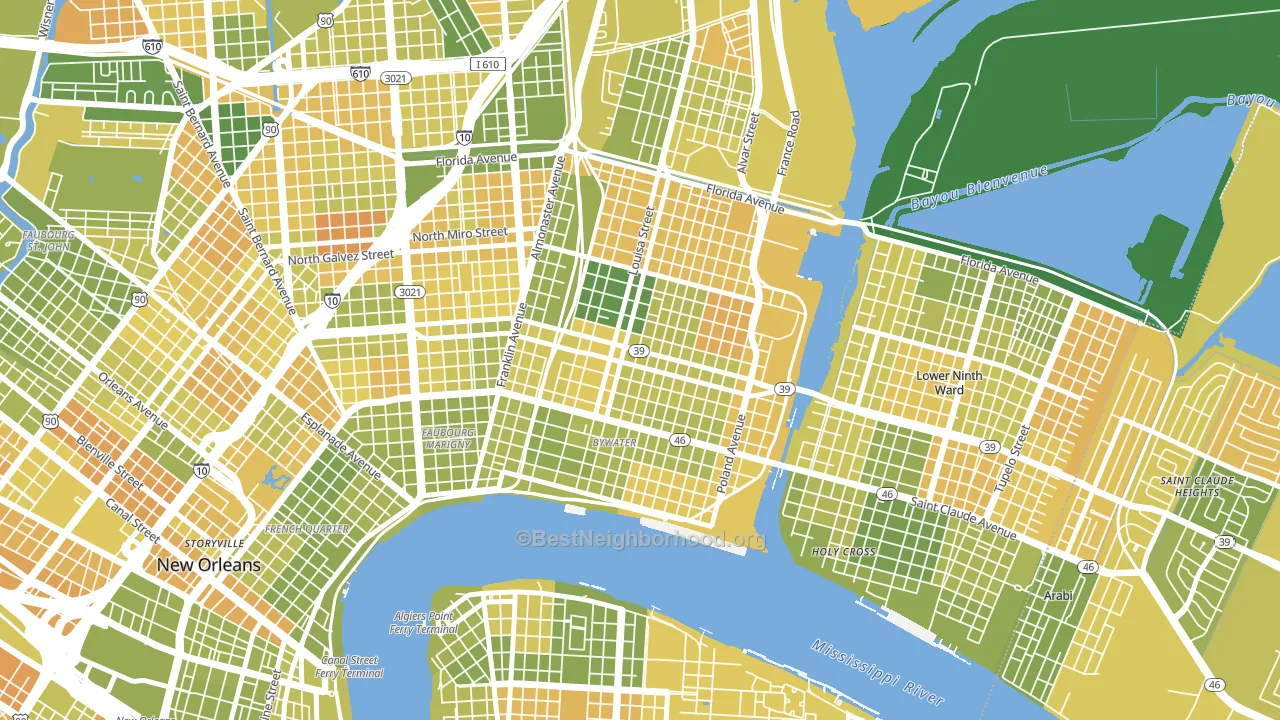
About 59% of adults in Saint Claude typically vote, near the U.S. average of about 62%. Among adults in Saint Claude, ~50% vote Democratic, ~9% Republican, and ~41% don't vote. The map below shows estimated turnout by block group.
How Saint Claude compares
Among neighborhoods within 5 miles, Saint Claude leans more Democratic than 17 of 35 neighbors.
Saint Claude runs about 93 points more Democratic than Louisiana as a whole. Louisiana leans Republican overall, while Saint Claude is one of the few Democratic-leaning pockets.
Politics vary noticeably by block within Saint Claude. The north side is the most Democratic-leaning (D+86) and the southwest side is the least Democratic-leaning (D+57), a spread of about 29 points.
Why Saint Claude leans the way it does
This analysis examined 14,881 data points per neighborhood to find what predicts political lean and turnout. The items below are a few correlations that stood out for Saint Claude, not a ranked or complete list of what matters most.
Dense areas vote Democratic. More than 99% of residents in Saint Claude live in densely developed areas, about 64 points above the U.S. average of 36%. A high never-married share predicts Democratic voting, and about 56% of adults in Saint Claude have never been married, above 89% of neighborhoods. Saint Claude runs against the grain of Louisiana, a Democratic-leaning pocket in a Republican-leaning state.
Population density and Democratic lean
Places with high population density tend to lean Democratic; Saint Claude, New Orleans, LA sits in the top quarter nationally on this measure.
Why turnout in Saint Claude looks the way it does
High-crime urban areas turn out at lower rates, mostly because the housing stress common in those areas makes voting harder. Saint Claude sits in the top 15% nationally on a violent-crime measure. See CrimeGrade for more details. High food insecurity lines up with lower turnout, and about 29% of adults in Saint Claude report food insecurity, above 81% of neighborhoods. Learn more about the findings and methodology on the political spectrum map.
Nearby Neighborhoods
- Bywater, New Orleans, LA D+63
- Saint Roch, New Orleans, LA D+79
- Lower 9th Ward, New Orleans, LA D+80
- Holy Cross, New Orleans, LA D+77
- French Quarter, New Orleans, LA D+46
- Seventh Ward, New Orleans, LA D+78
- Treme' Lafitte, New Orleans, LA D+76
- Gentilly Terrace, New Orleans, LA D+75
- Dillard, New Orleans, LA D+82
- Central Business District, New Orleans, LA D+50
Neighborhoods with Similar Populations
- Fort Sanders, Knoxville, TN D+36
- Saint Roch, New Orleans, LA D+79
- Winstead Park, Boise, ID D+20
- Las Cruces, Laredo, TX D+12
- Tallyn's Reach, Aurora, CO D+5
- Montrose, Chicago, IL D+39
- Harbor House, Charlotte, NC D+36
- Hillyard, Spokane, WA R+4
- Elliot Park, Minneapolis, MN D+63
- Nonantum, Newton, MA D+49
Sources and methodology
Precinct-level voting records used to fit the model come from Louisiana Secretary of State, Elections, distributed by the Voting and Election Science Team. Demographic inputs come from the U.S. Census Bureau (ACS 5-year estimates and the 2020 Decennial Census). Health and environmental inputs come from the CDC (PLACES and the Environmental Justice Index). Land cover comes from the USGS and EPA. Election-day and lead-up weather come from PRISM 4km daily grids and the NOAA Global Historical Climatology Network. Mail-voting and election-administration patterns come from the MIT Election Lab's Survey of the Performance of American Elections. Block-group crime detail comes from CrimeGrade. Internet data and modeling support provided by ISPreports.org.
Modeling and analysis by the BestNeighborhood data science team. Full methodology and findings: political spectrum map.
Methodology reviewed by the BestNeighborhood data team. Last updated May 2026.