Santa Fe is a Democratic stronghold. About 91% of voters here vote Democratic and 9% Republican.
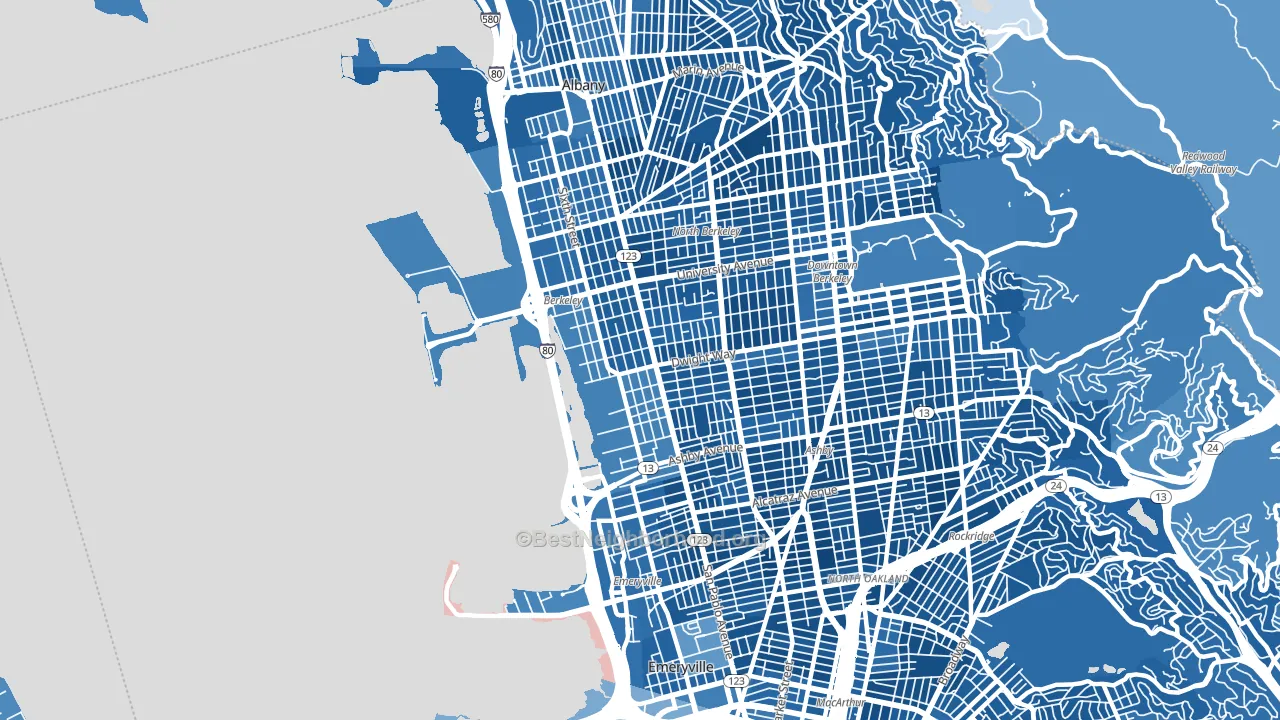
About 55% of adults in Santa Fe typically vote, below the U.S. average of about 62%. Among adults in Santa Fe, ~50% vote Democratic, ~5% Republican, and ~45% don't vote. The map below shows estimated turnout by block group.
How Santa Fe compares
Among neighborhoods within 5 miles, Santa Fe leans more Democratic than 25 of 43 neighbors.
Santa Fe runs about 61 points more Democratic than California as a whole.
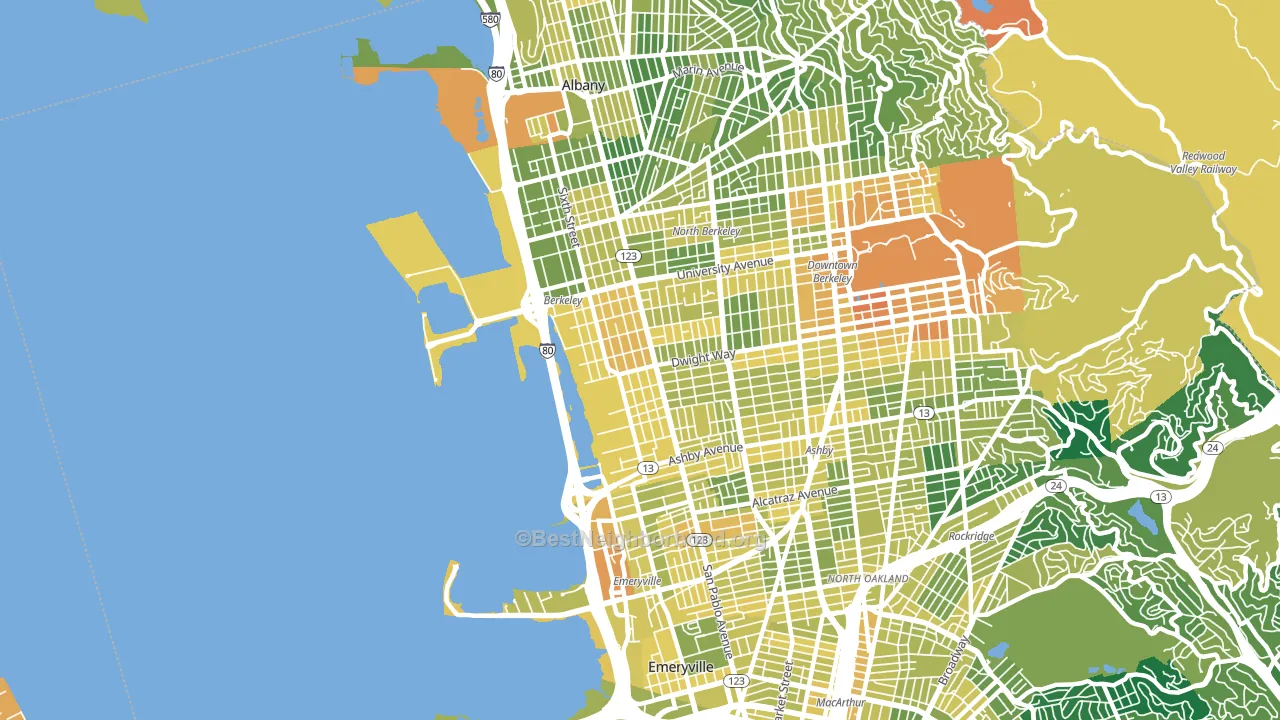
Politics vary noticeably by block within Santa Fe. The west side is the most Democratic-leaning (D+90) and the northwest side is the least Democratic-leaning (D+65), a spread of about 25 points.
Why Santa Fe leans the way it does
This analysis examined 14,881 data points per neighborhood to find what predicts political lean and turnout. The items below are a few correlations that stood out for Santa Fe, not a ranked or complete list of what matters most.
Dense areas vote Democratic. More than 99% of residents in Santa Fe live in densely developed areas, about 64 points above the U.S. average of 36%. High college attainment predicts Democratic voting, and Santa Fe sits in the top quarter (about 56%, above 77% of neighborhoods). A high never-married share predicts Democratic voting, and about 59% of adults in Santa Fe have never been married, above 92% of neighborhoods.
Population density and Democratic lean
Places with high population density tend to lean Democratic; Santa Fe, Emeryville, CA sits in the top tenth nationally on this measure.
Why turnout in Santa Fe looks the way it does
Renters vote less often than owners. About 68% of households in Santa Fe rent, about 43 points above the U.S. average of 25%. High-crime urban areas turn out at lower rates, and Santa Fe sits in the top 15% on a violent-crime measure. Learn more about the findings and methodology on the political spectrum map.
Nearby Neighborhoods
- SouthWest Berkeley, Berkeley, CA D+79
- Central Berkeley, Berkeley, CA D+84
- Northwest Berkeley, Berkeley, CA D+82
- Paradise Park, Emeryville, CA D+80
- Golden Gate, Emeryville, CA D+81
- Westbrae, Berkeley, CA D+87
- Downtown Berkeley, Berkeley, CA D+76
- South Berkeley, Berkeley, CA D+79
- Bushrod, Oakland, CA D+85
- North Berkeley, Berkeley, CA D+82
Neighborhoods with Similar Populations
- Italian Village, Coral Gables, FL D+3
- Oakley, Asheville, NC D+38
- Bayshore, Miami Beach, FL R+4
- Upper Rattlesnake, Missoula, MT D+47
- Lanning Square, Camden, NJ D+68
- Woodridge, Washington, DC D+88
- The Woodlands, Randallstown, MD D+83
- South Beach Miami Beach, Miami Beach, FL R+5
- Lykins, Kansas City, MO D+41
- Crescent Park, Palo Alto, CA D+68
Sources and methodology
Precinct-level voting records used to fit the model come from California Secretary of State, Elections, distributed by the Voting and Election Science Team. Demographic inputs come from the U.S. Census Bureau (ACS 5-year estimates and the 2020 Decennial Census). Health and environmental inputs come from the CDC (PLACES and the Environmental Justice Index). Land cover comes from the USGS and EPA. Election-day and lead-up weather come from PRISM 4km daily grids and the NOAA Global Historical Climatology Network. Mail-voting and election-administration patterns come from the MIT Election Lab's Survey of the Performance of American Elections. Block-group crime detail comes from CrimeGrade. Internet data and modeling support provided by ISPreports.org.
Modeling and analysis by the BestNeighborhood data science team. Full methodology and findings: political spectrum map.
Methodology reviewed by the BestNeighborhood data team. Last updated May 2026.