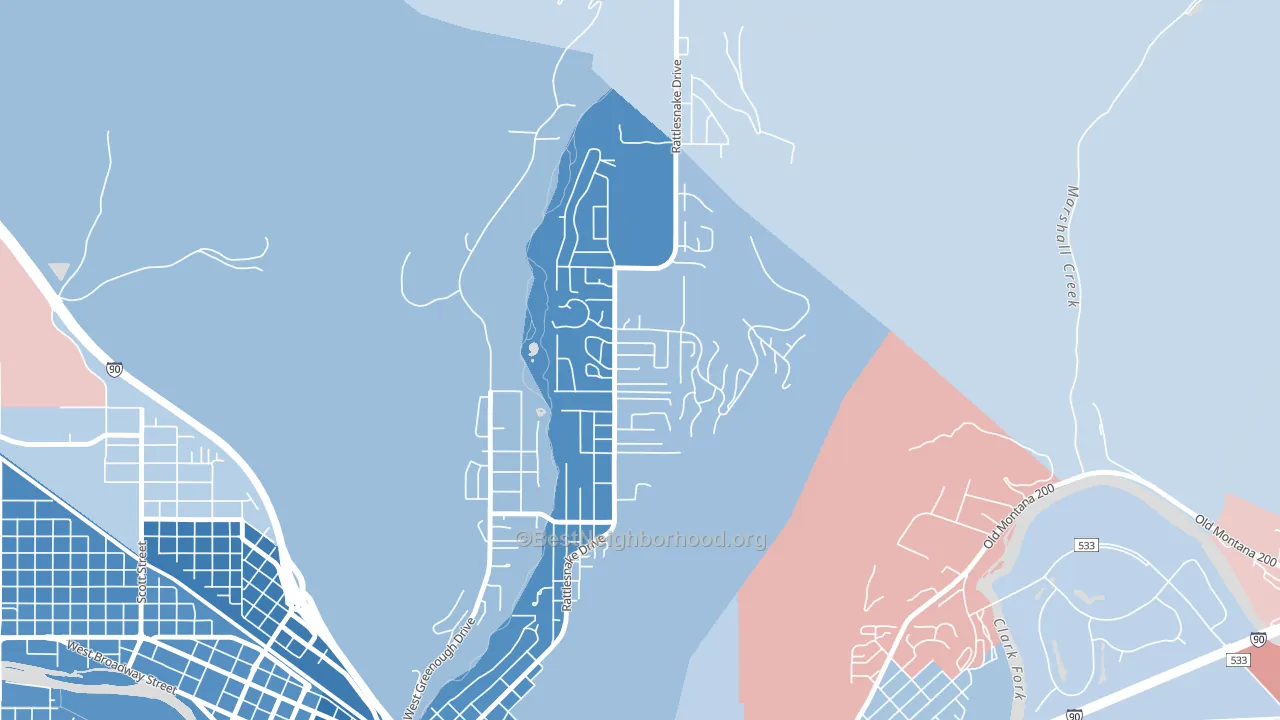
Upper Rattlesnake leans heavily Democratic by roughly 46 points: about 73% of voters vote Democratic and 27% Republican.
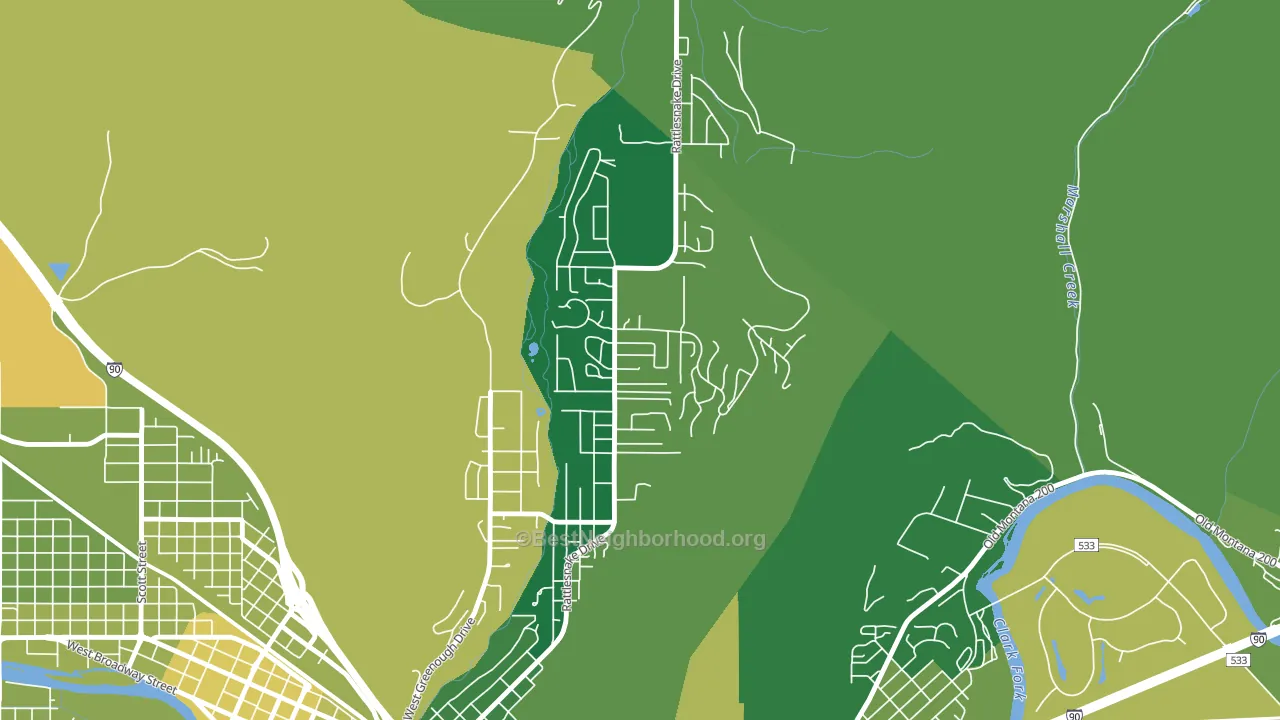
About 88% of adults in Upper Rattlesnake typically vote, above the U.S. average of about 62%. Among adults in Upper Rattlesnake, ~64% vote Democratic, ~24% Republican, and ~12% don't vote. The map below shows estimated turnout by block group.
How Upper Rattlesnake compares
Among neighborhoods within 5 miles, Upper Rattlesnake leans more Democratic than 6 of 10 neighbors.
Upper Rattlesnake runs about 67 points more Democratic than Montana as a whole. Montana leans Republican overall, while Upper Rattlesnake is one of the few Democratic-leaning pockets.
Politics vary noticeably by block within Upper Rattlesnake. The south side is the most Democratic-leaning (D+53) and the northeast side is the least Democratic-leaning (D+16), a spread of about 37 points.
Why Upper Rattlesnake leans the way it does
This analysis examined 14,881 data points per neighborhood to find what predicts political lean and turnout. The items below are a few correlations that stood out for Upper Rattlesnake, not a ranked or complete list of what matters most.
Areas with high college attainment vote Democratic. About 68% of adults in Upper Rattlesnake hold a bachelor's degree, about 40 points above the U.S. average of 28%. Upper Rattlesnake runs against the grain of Montana, a Democratic-leaning pocket in a Republican-leaning state.
High-school completion, developed land, and voter turnout
Places that combine high-school-completion-heavy adults and a rural land-use pattern tend to turn out at a higher rate, as Upper Rattlesnake, Missoula, MT does.
Why turnout in Upper Rattlesnake looks the way it does
Areas with strong routine healthcare access turn out at higher rates. Upper Rattlesnake is in the top quarter nationally for routine-care measures such as insurance coverage, preventive screenings, and dental visits. The dental-visit rate here is about 75%, about 15 points above the U.S. average of 60%. High high-school completion lines up with higher turnout, and about 99% of adults in Upper Rattlesnake have completed high school, above 88% of neighborhoods. Learn more about the findings and methodology on the political spectrum map.
Nearby Neighborhoods
- Northside, Missoula, MT D+34
- Heart of Missoula, Missoula, MT D+51
- Westside, Missoula, MT D+35
- University District, Missoula, MT D+59
- Rose Park, Missoula, MT D+59
- Emma Dickinson Orchard Homes, Missoula, MT D+31
- Franklin To The Fort, Missoula, MT D+29
- Lewis and Clark, Missoula, MT D+47
- Southgate Triangle, Missoula, MT D+26
- Captain John Mullan, Missoula, MT D+12
Neighborhoods with Similar Populations
- Lanning Square, Camden, NJ D+68
- Woodridge, Washington, DC D+88
- Lykins, Kansas City, MO D+41
- Oakley, Asheville, NC D+38
- Hawaiian Acres, Keaau, HI Even
- Lake Shore, New Orleans, LA D+3
- Crescent Park, Palo Alto, CA D+68
- Santa Fe, Emeryville, CA D+81
- Italian Village, Coral Gables, FL D+3
- East Hillside, Duluth, MN D+55
Sources and methodology
Precinct-level voting records used to fit the model come from Montana Secretary of State, Elections, distributed by the Voting and Election Science Team. Demographic inputs come from the U.S. Census Bureau (ACS 5-year estimates and the 2020 Decennial Census). Health and environmental inputs come from the CDC (PLACES and the Environmental Justice Index). Land cover comes from the USGS and EPA. Election-day and lead-up weather come from PRISM 4km daily grids and the NOAA Global Historical Climatology Network. Mail-voting and election-administration patterns come from the MIT Election Lab's Survey of the Performance of American Elections. Block-group crime detail comes from CrimeGrade. Internet data and modeling support provided by ISPreports.org.
Modeling and analysis by the BestNeighborhood data science team. Full methodology and findings: political spectrum map.
Methodology reviewed by the BestNeighborhood data team. Last updated May 2026.