Schuyler County leans heavily Republican by roughly 44 points: about 28% of voters vote Democratic and 72% Republican.
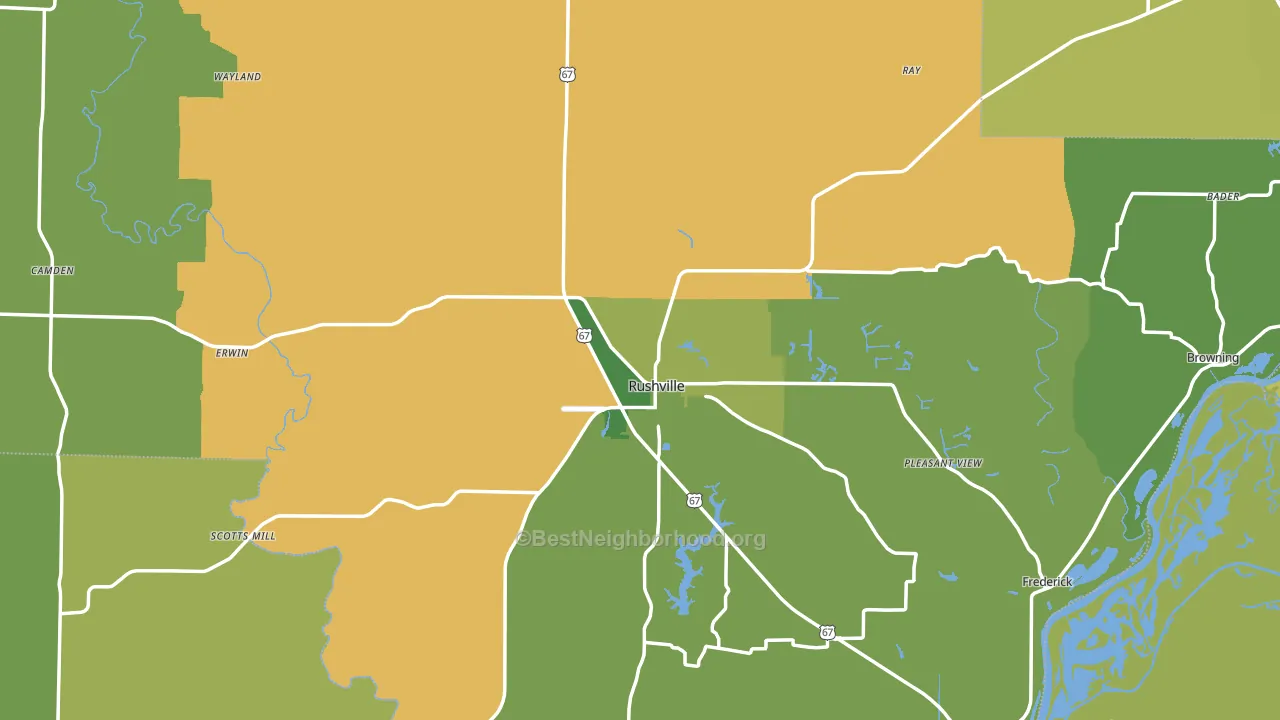
About 72% of adults in Schuyler County typically vote, above the U.S. average of about 62%. Among adults in Schuyler County, ~20% vote Democratic, ~52% Republican, and ~28% don't vote. The map below shows estimated turnout by block group.
How Schuyler County compares
Among counties within 50 miles, Schuyler County leans more Republican than 7 of 11 neighbors.
Schuyler County runs about 55 points more Republican than Illinois as a whole. Illinois leans Democratic overall, while Schuyler County is one of the few Republican-leaning pockets.
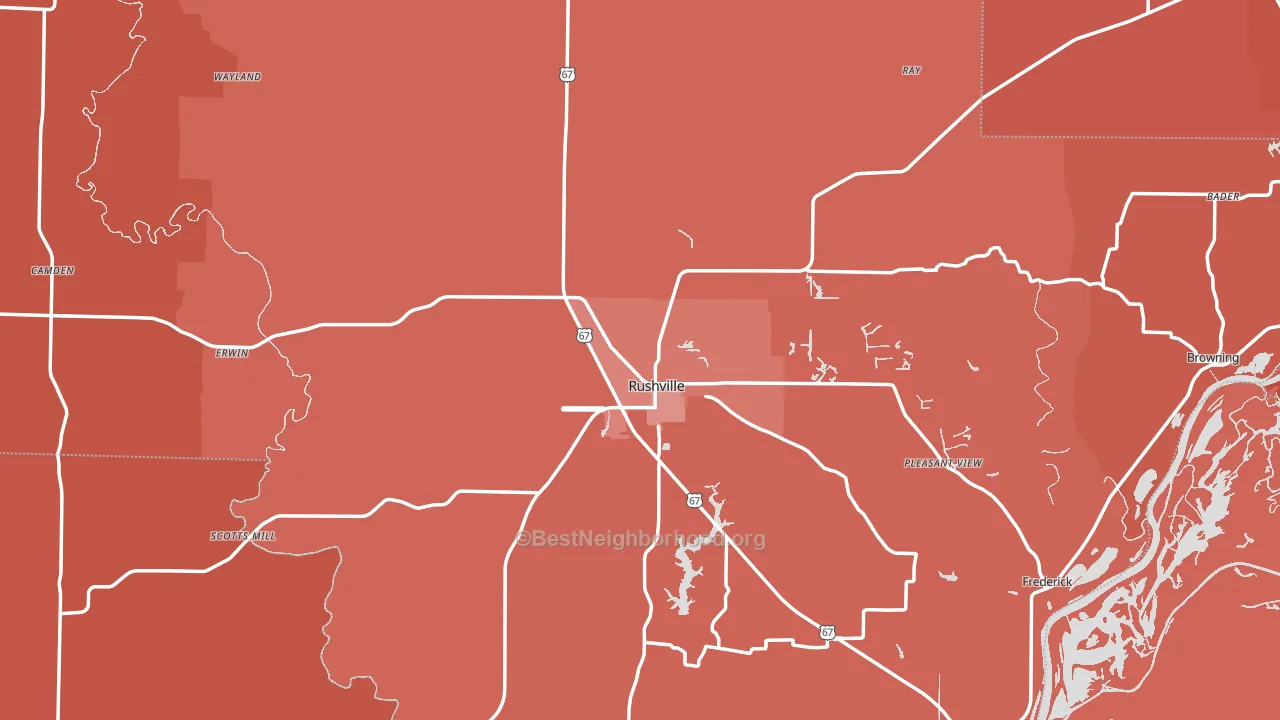
Politics vary noticeably by city within Schuyler County. The east side is the most Republican-leaning (R+52) and the south side is the least Republican-leaning (R+38), a spread of about 14 points.
Why Schuyler County leans the way it does
This analysis examined 14,881 data points per county to find what predicts political lean and turnout. The items below are a few correlations that stood out for Schuyler County, not a ranked or complete list of what matters most.
Car-dependent areas vote Republican. About 85% of residents in Schuyler County drive to work alone, about 12 points above the U.S. average of 74%. Schuyler County runs against the grain of Illinois, a Republican-leaning pocket in a Democratic-leaning state.
Homeownership and voter turnout
Places with homeowner-heavy households tend to turn out at a higher rate; Schuyler County, IL sits in the top quarter nationally on this measure.
Why turnout in Schuyler County looks the way it does
Homeowners vote more often than renters. About 81% of households in Schuyler County own their home, about 5 points above the U.S. average of 75%. Learn more about the findings and methodology on the political spectrum map.
Nearby Counties
- Brown County, IL R+39
- Cass County, IL R+31
- McDonough County, IL R+11
- Morgan County, IL R+25
- Scott County, IL R+64
- Fulton County, IL R+31
- Mason County, IL R+46
- Pike County, IL R+57
- Hancock County, IL R+45
- Menard County, IL R+41
Counties with Similar Populations
- Bailey County, TX R+49
- Wabaunsee County, KS R+53
- Powell County, MT R+48
- Pembina County, ND R+51
- Weston County, WY R+68
- Tillman County, OK R+55
- Swisher County, TX R+48
- Fall River County, SD R+52
- Forest County, PA R+24
- Huerfano County, CO R+7
Sources and methodology
Precinct-level voting records used to fit the model come from Illinois State Board of Elections, distributed by the Voting and Election Science Team. Demographic inputs come from the U.S. Census Bureau (ACS 5-year estimates and the 2020 Decennial Census). Health and environmental inputs come from the CDC (PLACES and the Environmental Justice Index). Land cover comes from the USGS and EPA. Election-day and lead-up weather come from PRISM 4km daily grids and the NOAA Global Historical Climatology Network. Mail-voting and election-administration patterns come from the MIT Election Lab's Survey of the Performance of American Elections. Block-group crime detail comes from CrimeGrade. Internet data and modeling support provided by ISPreports.org.
Modeling and analysis by the BestNeighborhood data science team. Full methodology and findings: political spectrum map.
Methodology reviewed by the BestNeighborhood data team. Last updated May 2026.