Centennial Hills is a true toss-up. About 51% of voters here vote Democratic and 49% Republican.
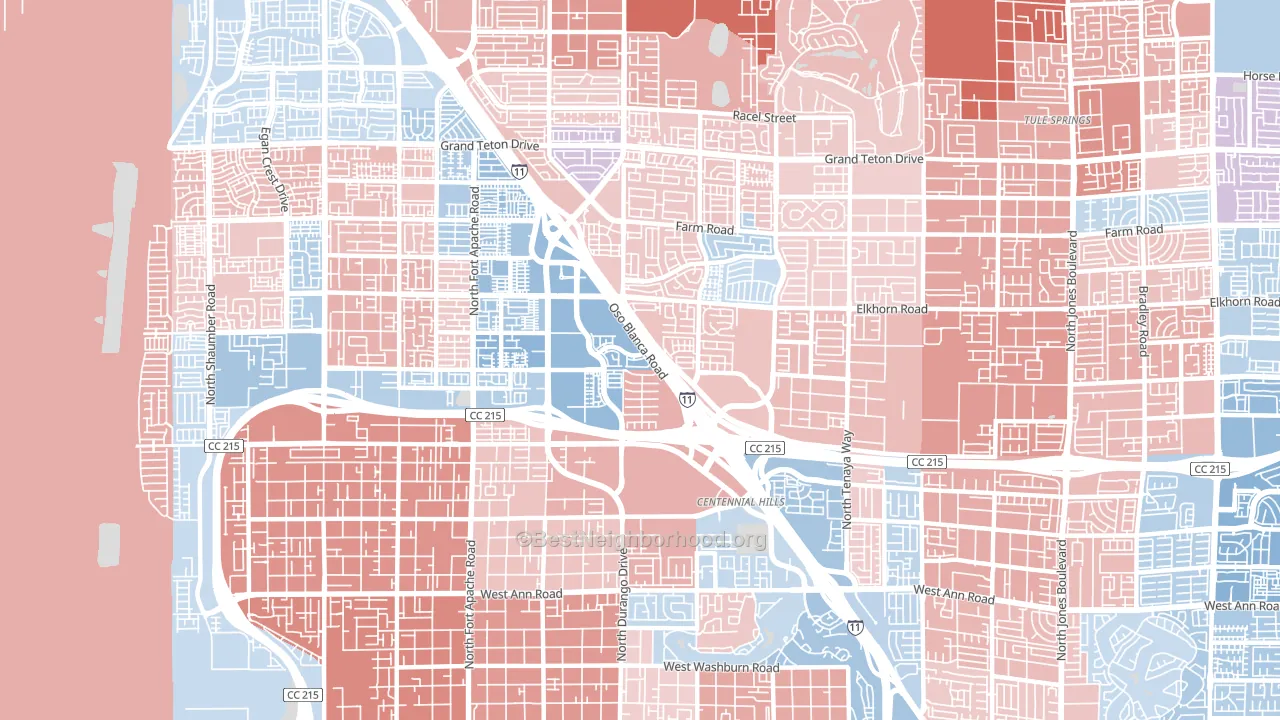
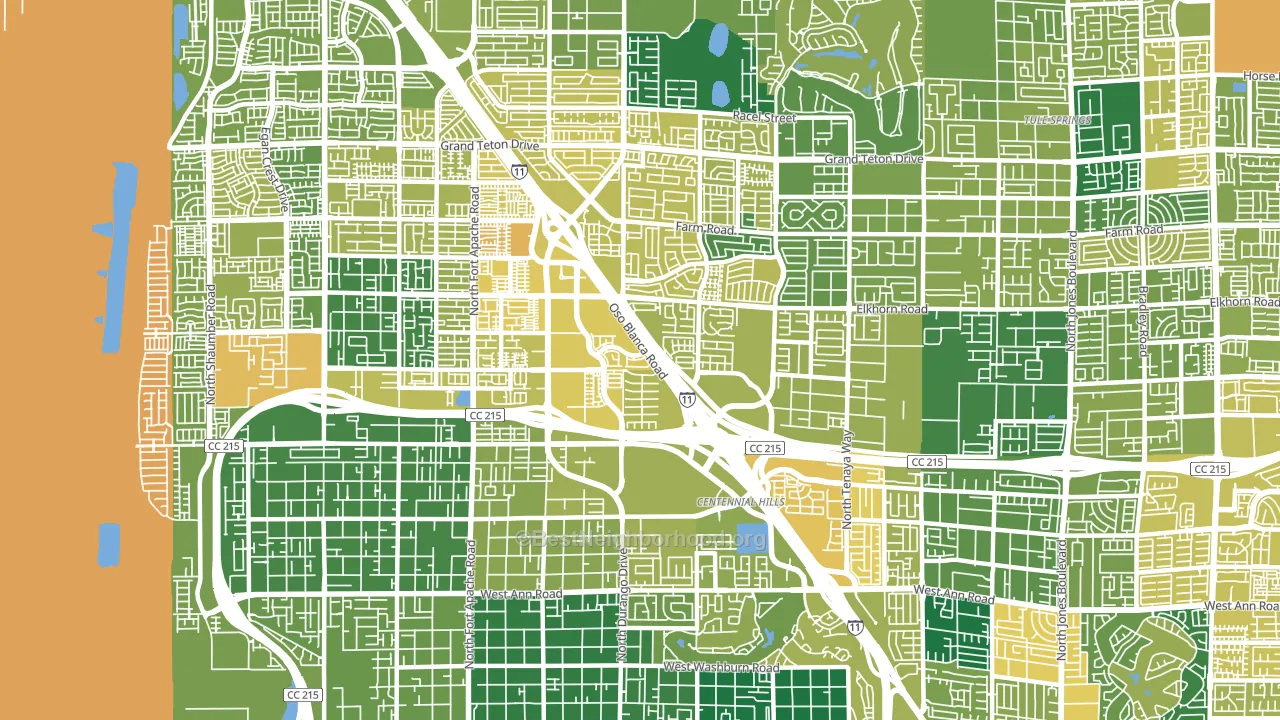
About 67% of adults in Centennial Hills typically vote, near the U.S. average of about 62%. Among adults in Centennial Hills, ~34% vote Democratic, ~33% Republican, and ~33% don't vote. The map below shows estimated turnout by block group.
How Centennial Hills compares
Among neighborhoods within 5 miles, Centennial Hills sits roughly in the middle of the political spectrum, with 4 neighbors leaning further in the place's direction and 1 leaning the other way.
Centennial Hills runs about 5 points more Democratic than Nevada as a whole.
Politics vary noticeably by block within Centennial Hills. The west side runs the most Democratic (D+7) and the southwest side runs the most Republican (R+16), a spread of about 23 points.
Why Centennial Hills leans the way it does
Density, race composition, education, and family structure all sit close to their national averages in Centennial Hills. The lean here lands roughly where demographic data alone would predict.
Population density and Democratic lean
Places with high population density tend to lean Democratic; Centennial Hills, Las Vegas, NV sits in the top quarter nationally on this measure.
Why turnout in Centennial Hills looks the way it does
Turnout in Centennial Hills sits close to the national pattern. Routine healthcare access, homeownership, education, and food security all land near their national averages here. Learn more about the findings and methodology on the political spectrum map.
Nearby Neighborhoods
- Tule Springs, Las Vegas, NV R+13
- Kyle Canyon, Las Vegas, NV Even
- Sheep Mountain, Las Vegas, NV R+12
- North Cheyenne, Las Vegas, NV Even
- Lone Mountain, Las Vegas, NV D+6
- Desert Shores, Las Vegas, NV D+22
- Sun City Summerlin, Las Vegas, NV D+8
- The Pueblo, Las Vegas, NV D+13
- The Trails, Las Vegas, NV D+9
- Michael Way, Las Vegas, NV D+22
Neighborhoods with Similar Populations
- Flagami, Miami, FL R+35
- Santa Teresa, San Jose, CA D+26
- Otay Ranch, Chula Vista, CA D+16
- Gramercy, Manhattan, NY D+65
- Fresno-High, Fresno, CA D+23
- Fordham, Bronx, NY D+36
- Southeast Arlington, Arlington, TX D+26
- Western Addition, San Francisco, CA D+73
- The Heights, Jersey City, NJ D+30
- Woodward Park, Fresno, CA R+7
Sources and methodology
Precinct-level voting records used to fit the model come from Nevada Secretary of State, Elections, distributed by the Voting and Election Science Team. Demographic inputs come from the U.S. Census Bureau (ACS 5-year estimates and the 2020 Decennial Census). Health and environmental inputs come from the CDC (PLACES and the Environmental Justice Index). Land cover comes from the USGS and EPA. Election-day and lead-up weather come from PRISM 4km daily grids and the NOAA Global Historical Climatology Network. Mail-voting and election-administration patterns come from the MIT Election Lab's Survey of the Performance of American Elections. Block-group crime detail comes from CrimeGrade. Internet data and modeling support provided by ISPreports.org.
Modeling and analysis by the BestNeighborhood data science team. Full methodology and findings: political spectrum map.
Methodology reviewed by the BestNeighborhood data team. Last updated May 2026.