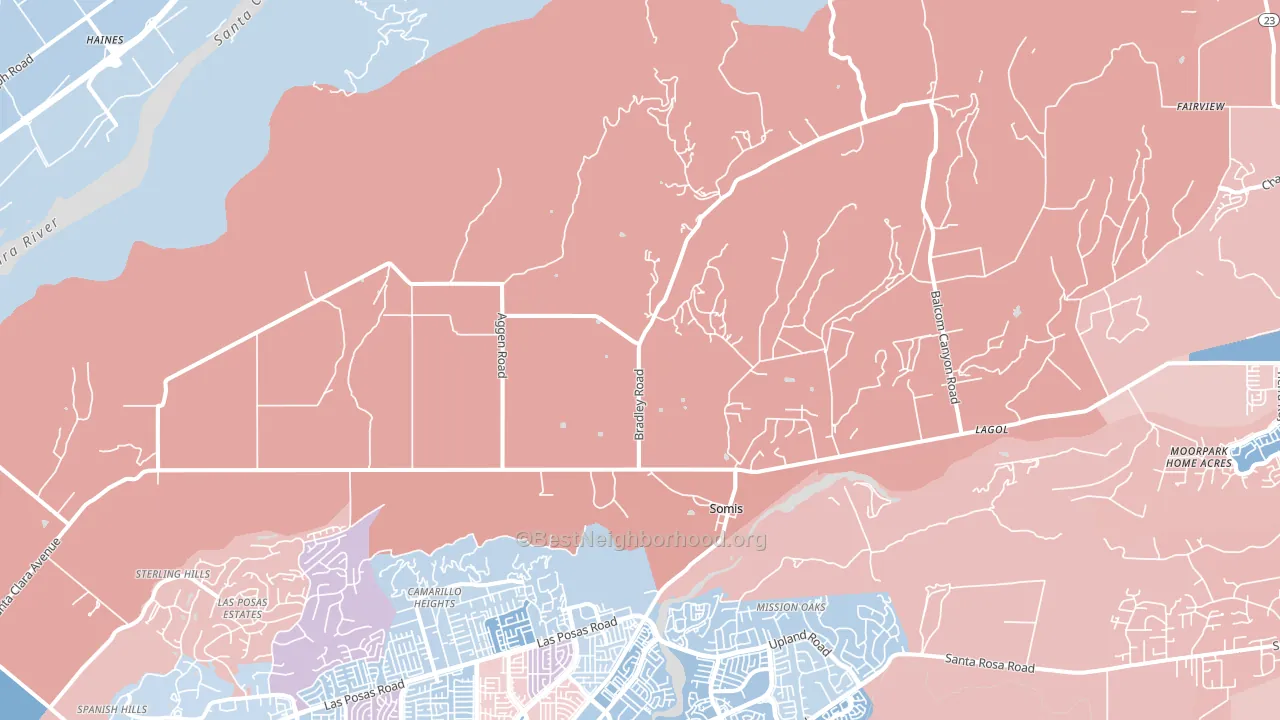
Somis leans slightly Republican by roughly 12 points: about 44% of voters vote Democratic and 56% Republican.
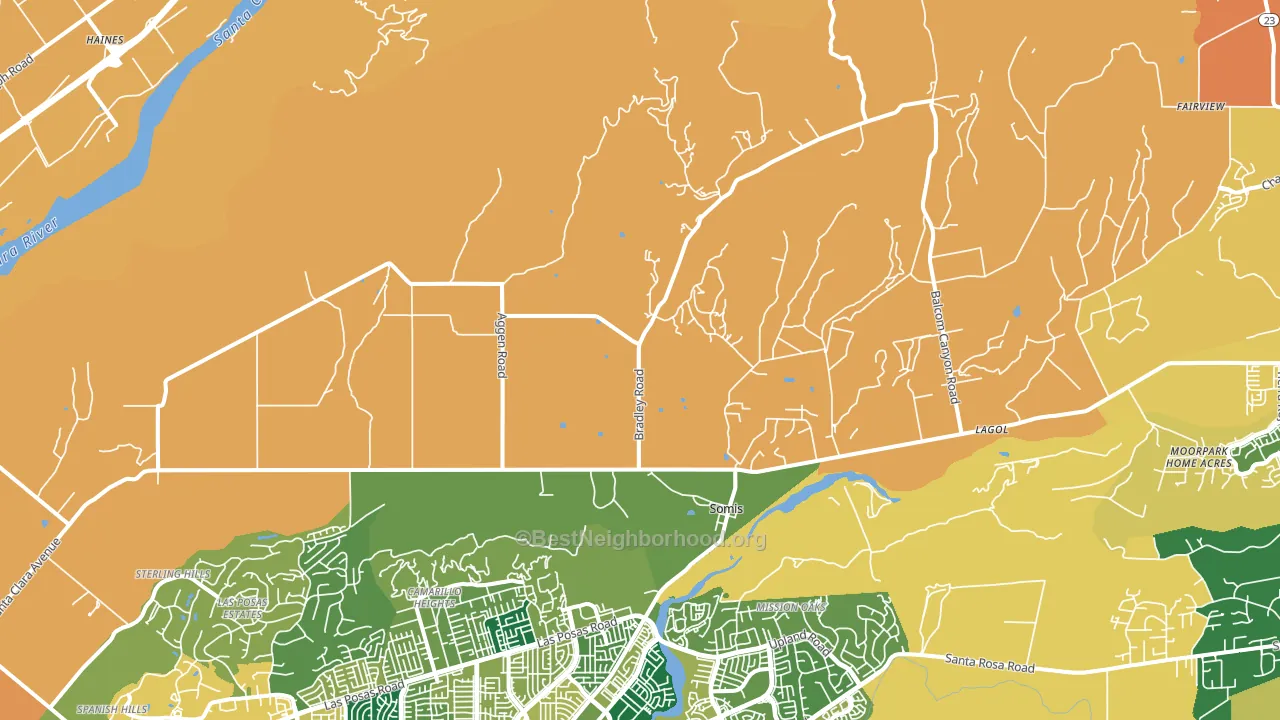
About 51% of adults in Somis typically vote, below the U.S. average of about 62%. Among adults in Somis, ~22% vote Democratic, ~28% Republican, and ~50% don't vote. The map below shows estimated turnout by block group.
How Somis compares
Among cities within 25 miles, Somis leans more Republican than 37 of 39 neighbors.
Somis runs about 33 points more Republican than California as a whole. California leans Democratic overall, while Somis is one of the few Republican-leaning pockets.
Politics vary noticeably by neighborhood within Somis. The east side is the most split-leaning (R+16) and the north side is the least split-leaning (R+3), a spread of about 13 points.
Why Somis leans the way it does
This analysis examined 14,881 data points per city to find what predicts political lean and turnout. The items below are a few correlations that stood out for Somis, not a ranked or complete list of what matters most.
Somis votes against the grain of California. California leans Democratic overall, while Somis runs about 33 points more Republican.
Never-married share, developed land, and voter turnout
Places that combine a never-married-heavy adult population and a heavily developed built environment tend to turn out at a lower rate, as Somis, CA does.
Why turnout in Somis looks the way it does
Areas with low high-school completion turn out at lower rates. About 86% of adults in Somis have completed high school, below 75% of cities. Strong routine healthcare access lines up with higher turnout, and Somis sits in the top quarter on routine-care measures. Crowded housing lines up with lower turnout, and about 6% of homes in Somis have more than one occupant per room, above 90% of cities. Learn more about the findings and methodology on the political spectrum map.
Nearby Cities
- Moorpark Home Acres, CA R+13
- Camarillo, CA D+8
- Santa Paula, CA D+21
- Moorpark, CA D+8
- Newbury Park, CA D+13
- Sespe, CA R+8
- Virginia Colony, CA R+7
- Thousand Oaks, CA D+11
- Fillmore, CA D+5
- Oxnard, CA D+16
Cities with Similar Populations
- Kiefer, OK R+58
- Winchester, OR R+21
- Elsie, MI R+36
- Pine City, NY R+33
- Linden, CA R+38
- Elim, PA R+23
- Plum Grove, TX R+38
- Richmond, UT R+67
- Dyer, TN R+58
- Moreland Hills, OH D+22
Sources and methodology
Precinct-level voting records used to fit the model come from California Secretary of State, Elections, distributed by the Voting and Election Science Team. Demographic inputs come from the U.S. Census Bureau (ACS 5-year estimates and the 2020 Decennial Census). Health and environmental inputs come from the CDC (PLACES and the Environmental Justice Index). Land cover comes from the USGS and EPA. Election-day and lead-up weather come from PRISM 4km daily grids and the NOAA Global Historical Climatology Network. Mail-voting and election-administration patterns come from the MIT Election Lab's Survey of the Performance of American Elections. Block-group crime detail comes from CrimeGrade. Internet data and modeling support provided by ISPreports.org.
Modeling and analysis by the BestNeighborhood data science team. Full methodology and findings: political spectrum map.
Methodology reviewed by the BestNeighborhood data team. Last updated May 2026.