Sonoma Ranch is a true toss-up. About 48% of voters here vote Democratic and 52% Republican.
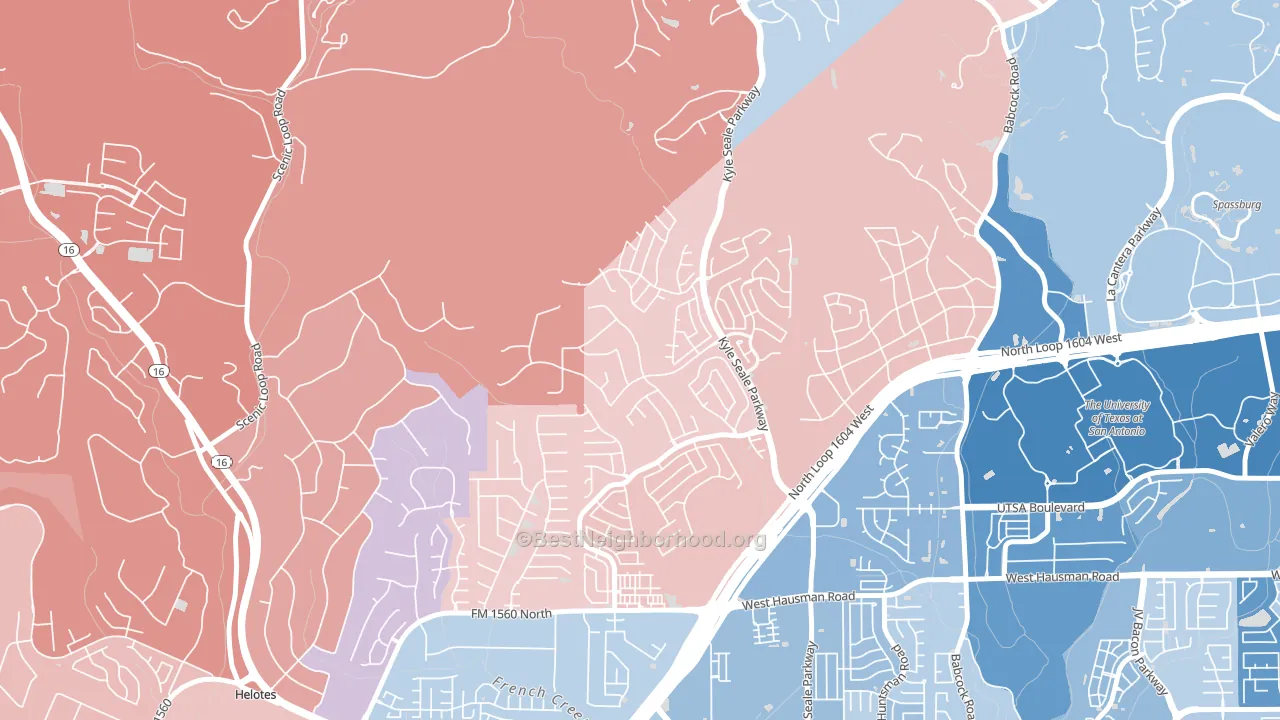
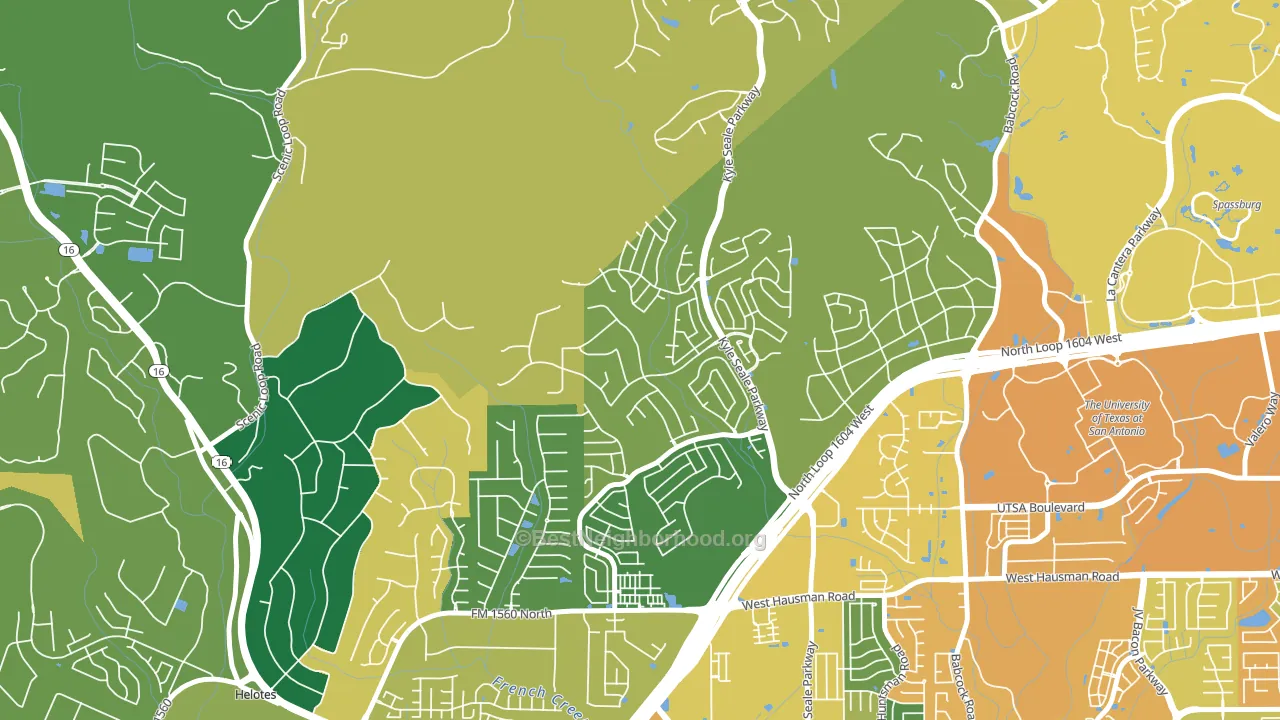
About 79% of adults in Sonoma Ranch typically vote, above the U.S. average of about 62%. Among adults in Sonoma Ranch, ~38% vote Democratic, ~41% Republican, and ~21% don't vote. The map below shows estimated turnout by block group.
How Sonoma Ranch compares
Among neighborhoods within 5 miles, Sonoma Ranch is the most Republican-leaning.
Sonoma Ranch runs about 10 points more Democratic than Texas as a whole.
Politics vary noticeably by block within Sonoma Ranch. The east side runs the most Democratic (Even) and the northeast side runs the most Republican (R+16), a spread of about 16 points.
Why Sonoma Ranch leans the way it does
Density, race composition, education, and family structure all sit close to their national averages in Sonoma Ranch. The lean here lands roughly where demographic data alone would predict.
Walkability and Republican lean
Places with a low walkability score tend to lean Republican; Sonoma Ranch, Helotes, TX sits in the bottom quarter nationally on this measure. A walkable street grid does not change how people vote; it mostly reflects how urban a place is.
Why turnout in Sonoma Ranch looks the way it does
Areas with strong routine healthcare access turn out at higher rates. Sonoma Ranch is in the top quarter nationally for routine-care measures such as insurance coverage, preventive screenings, and dental visits. The dental-visit rate here is about 72%, about 12 points above the U.S. average of 60%. Homeowners vote more often than renters, and about 95% of households in Sonoma Ranch own their home, compared to around 64% in nearby neighborhoods. High high-school completion lines up with higher turnout, and about 99% of adults in Sonoma Ranch have completed high school, above 89% of neighborhoods. Learn more about the findings and methodology on the political spectrum map.
Nearby Neighborhoods
- College Park San Antonio, San Antonio, TX D+15
- Parkwood Maintenance, San Antonio, TX D+11
- Braun's Farm, San Antonio, TX D+8
- Friends of Friedrich Wilderness Park, San Antonio, TX Even
- Braun Station West, San Antonio, TX R+4
- Alamo Farmsteads-Babcock Road, San Antonio, TX D+13
- Wildhorse, San Antonio, TX D+2
- Woods of Shavano, San Antonio, TX D+9
- Northwest Crossing, San Antonio, TX D+13
- The Dominion, San Antonio, TX R+15
Neighborhoods with Similar Populations
- Avalon Park Northwest Village, Alafaya, FL D+5
- Meadowood, Madison, WI D+62
- Downtown Fremont Historic District, Fremont, OH R+4
- Holiday Park, St. Petersburg, FL R+8
- Saint Anthony, New Orleans, LA D+72
- Filbert-Winesap, Bothell West, WA D+18
- Denver Harbor-Port Houston, Houston, TX D+29
- Washington Avenue-Memorial Park, Houston, TX D+23
- Whipper Barnoy, North Charleston, SC D+74
- Riviera-Westchester, Bakersfield, CA R+10
Sources and methodology
Precinct-level voting records used to fit the model come from Texas Secretary of State, Elections Division, distributed by the Voting and Election Science Team. Demographic inputs come from the U.S. Census Bureau (ACS 5-year estimates and the 2020 Decennial Census). Health and environmental inputs come from the CDC (PLACES and the Environmental Justice Index). Land cover comes from the USGS and EPA. Election-day and lead-up weather come from PRISM 4km daily grids and the NOAA Global Historical Climatology Network. Mail-voting and election-administration patterns come from the MIT Election Lab's Survey of the Performance of American Elections. Block-group crime detail comes from CrimeGrade. Internet data and modeling support provided by ISPreports.org.
Modeling and analysis by the BestNeighborhood data science team. Full methodology and findings: political spectrum map.
Methodology reviewed by the BestNeighborhood data team. Last updated May 2026.