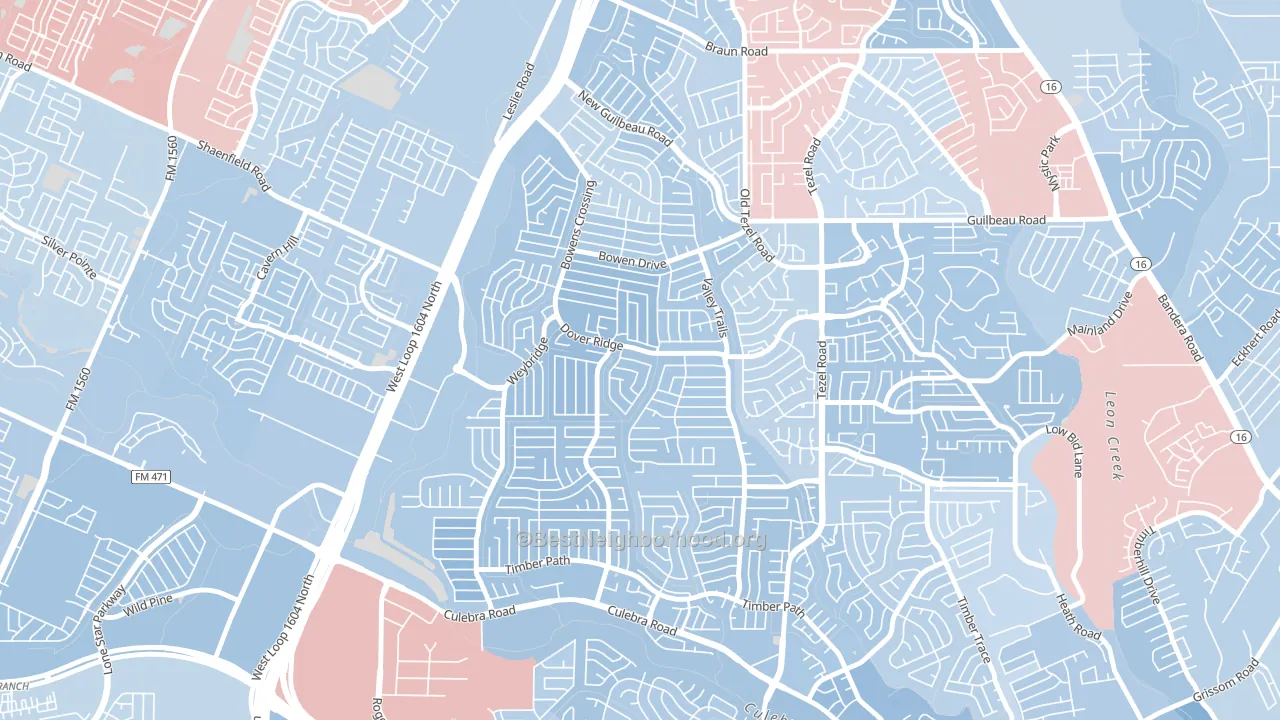
Northwest Crossing leans slightly Democratic by roughly 12 points: about 56% of voters vote Democratic and 44% Republican.
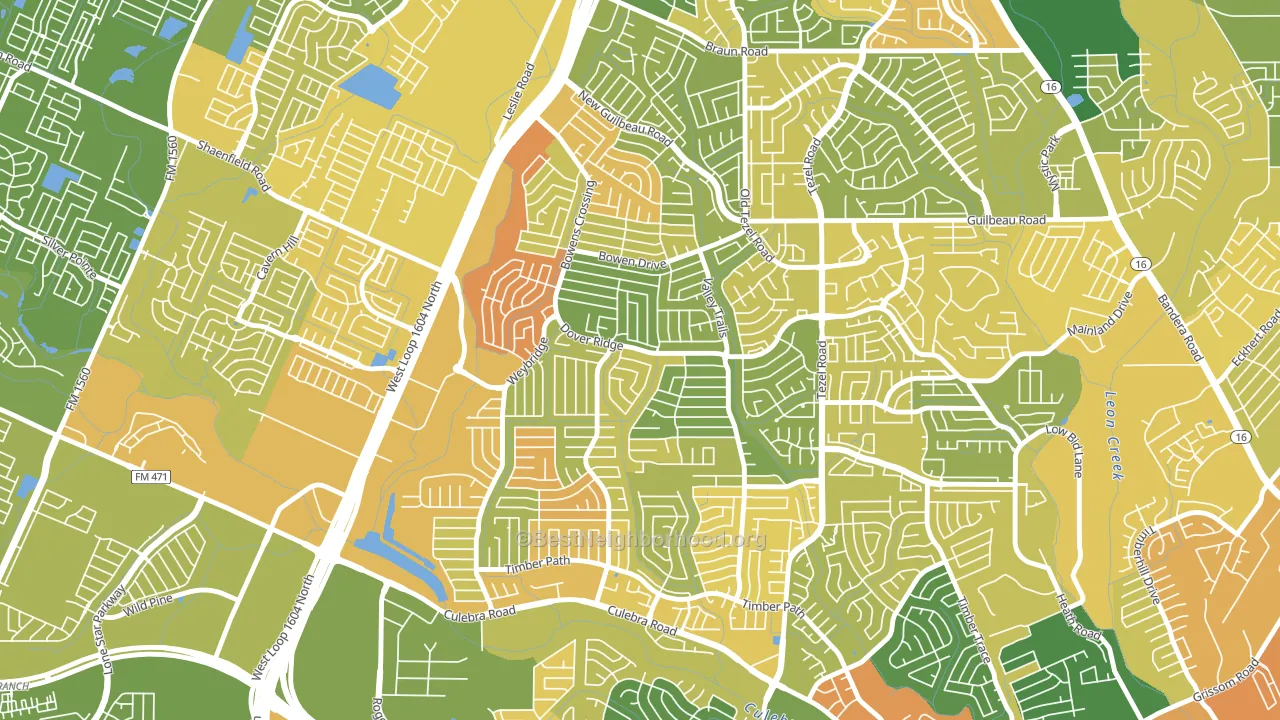
About 63% of adults in Northwest Crossing typically vote, near the U.S. average of about 62%. Among adults in Northwest Crossing, ~35% vote Democratic, ~28% Republican, and ~37% don't vote. The map below shows estimated turnout by block group.
How Northwest Crossing compares
Among neighborhoods within 5 miles, Northwest Crossing leans more Democratic than 8 of 12 neighbors.
Northwest Crossing runs about 27 points more Democratic than Texas as a whole. Texas leans Republican overall, while Northwest Crossing is one of the few Democratic-leaning pockets.
Politics vary noticeably by block within Northwest Crossing. The southwest side is the most Democratic-leaning (D+18) and the northeast side is the least Democratic-leaning (D+8), a spread of about 10 points.
Why Northwest Crossing leans the way it does
This analysis examined 14,881 data points per neighborhood to find what predicts political lean and turnout. The items below are a few correlations that stood out for Northwest Crossing, not a ranked or complete list of what matters most.
Northwest Crossing votes against the grain of Texas. Texas leans Republican overall, while Northwest Crossing runs about 27 points more Democratic.
Paved land cover and Democratic lean
Places with extensive paved surfaces tend to lean Democratic; Northwest Crossing, San Antonio, TX sits above the national average on this measure. Paved ground does not change how people vote; it mostly reflects how urban and built-up a place is.
Why turnout in Northwest Crossing looks the way it does
Areas with limited routine healthcare access turn out at lower rates. Northwest Crossing is in the bottom quarter nationally for routine-care measures such as insurance coverage, preventive screenings, and dental visits. Learn more about the findings and methodology on the political spectrum map.
Nearby Neighborhoods
- Great Northwest, San Antonio, TX D+10
- Braun Station West, San Antonio, TX R+4
- San Antonio Creekside, San Antonio, TX D+11
- Wildhorse, San Antonio, TX D+2
- Braun's Farm, San Antonio, TX D+8
- Timber Ridge, San Antonio, TX D+15
- Parkwood Maintenance, San Antonio, TX D+11
- Pipers Meadow, San Antonio, TX D+21
- Crown Meadows, San Antonio, TX D+22
- Alamo Farmsteads-Babcock Road, San Antonio, TX D+13
Neighborhoods with Similar Populations
- Logan, Spokane, WA D+30
- Buckman, Portland, OR D+80
- Wade, Raleigh, NC D+44
- Taku-Campbell, Anchorage, AK D+21
- Contempo, Union City, CA D+30
- South East, Pasadena, CA D+56
- West University Austin, Austin, TX D+57
- Avenues West, Milwaukee, WI D+52
- Northern Arizona University, Flagstaff, AZ D+63
- College Point, Queens, NY R+6
Sources and methodology
Precinct-level voting records used to fit the model come from Texas Secretary of State, Elections Division, distributed by the Voting and Election Science Team. Demographic inputs come from the U.S. Census Bureau (ACS 5-year estimates and the 2020 Decennial Census). Health and environmental inputs come from the CDC (PLACES and the Environmental Justice Index). Land cover comes from the USGS and EPA. Election-day and lead-up weather come from PRISM 4km daily grids and the NOAA Global Historical Climatology Network. Mail-voting and election-administration patterns come from the MIT Election Lab's Survey of the Performance of American Elections. Block-group crime detail comes from CrimeGrade. Internet data and modeling support provided by ISPreports.org.
Modeling and analysis by the BestNeighborhood data science team. Full methodology and findings: political spectrum map.
Methodology reviewed by the BestNeighborhood data team. Last updated May 2026.