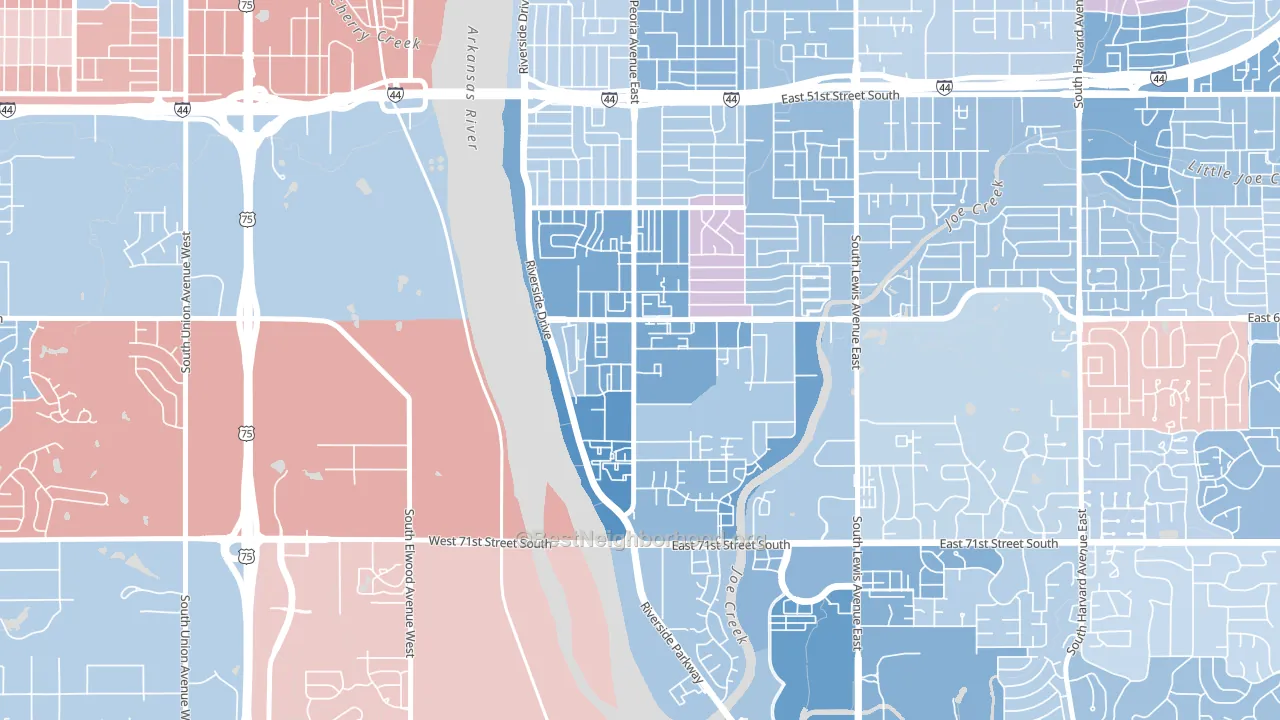
South Peoria leans Democratic by roughly 28 points: about 64% of voters vote Democratic and 36% Republican.
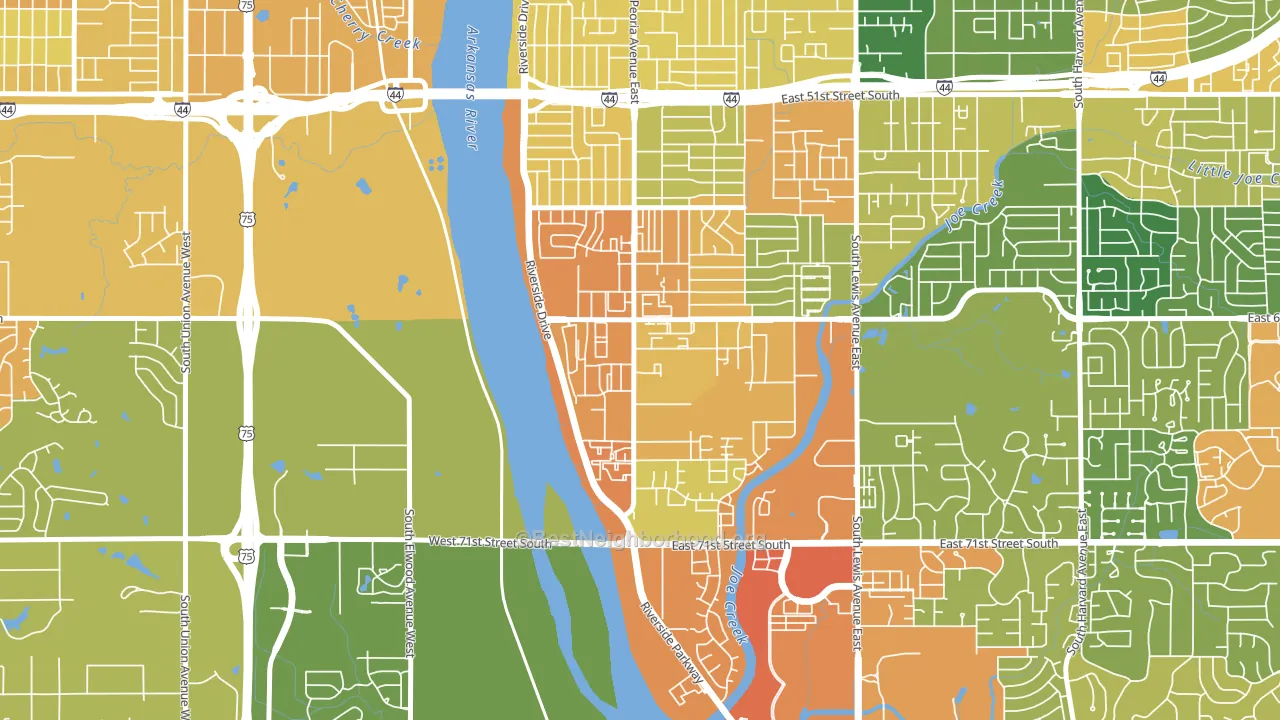
About 34% of adults in South Peoria typically vote, below the U.S. average of about 62%. Among adults in South Peoria, ~22% vote Democratic, ~12% Republican, and ~66% don't vote. The map below shows estimated turnout by block group.
How South Peoria compares
Among neighborhoods within 5 miles, South Peoria leans more Democratic than 5 of 6 neighbors.
South Peoria runs about 77 points more Democratic than Oklahoma as a whole. Oklahoma leans Republican overall, while South Peoria is one of the few Democratic-leaning pockets.
Politics vary noticeably by block within South Peoria. The south side is the most Democratic-leaning (D+48) and the north side is the least Democratic-leaning (D+12), a spread of about 36 points.
Why South Peoria leans the way it does
This analysis examined 14,881 data points per neighborhood to find what predicts political lean and turnout. The items below are a few correlations that stood out for South Peoria, not a ranked or complete list of what matters most.
South Peoria votes against the grain of Oklahoma. Oklahoma leans Republican overall, while South Peoria runs about 77 points more Democratic. A high never-married share predicts Democratic voting, and about 47% of adults in South Peoria have never been married, above 77% of neighborhoods.
Preventive-care access and voter turnout
Places with limited routine preventive-care access tend to turn out at a lower rate; South Peoria, Tulsa, OK sits in the bottom quarter nationally on this measure. Dental visits do not drive turnout; the rate reflects income, insurance, and healthcare access, which line up with who votes.
Why turnout in South Peoria looks the way it does
Renters vote less often than owners. About 77% of households in South Peoria rent, about 52 points above the U.S. average of 25%. Limited routine healthcare access lines up with lower turnout, and South Peoria sits in the bottom quarter on routine-care measures. High food insecurity lines up with lower turnout, and about 33% of adults in South Peoria report food insecurity, above 86% of neighborhoods. Learn more about the findings and methodology on the political spectrum map.
Nearby Neighborhoods
- Heller Park, Tulsa, OK D+19
- Kensington, Tulsa, OK D+21
- Brookside, Tulsa, OK D+16
- Minshall Park, Tulsa, OK D+5
- Riverview Park, Tulsa, OK D+41
- Mayo Meadow, Tulsa, OK D+18
- Downtown Tulsa, Tulsa, OK D+44
- Turner Park, Tulsa, OK D+19
- Charles Page, Tulsa, OK R+12
- Sequoyah, Tulsa, OK D+11
Neighborhoods with Similar Populations
- North Loop, Minneapolis, MN D+65
- Spice Tract, Bakersfield, CA Even
- Park Central Area, Abilene, TX R+16
- Old Mountain View, Mountain View, CA D+60
- Franklin Randolph, Boise, ID Even
- Warren Point, Fair Lawn, NJ Even
- Ukrainian Village, Parma, OH Even
- Walnut Hills, Cincinnati, OH D+74
- Mount Hope, San Diego, CA D+35
- Stella Mann, Tucson, AZ D+12
Sources and methodology
Precinct-level voting records used to fit the model come from Oklahoma State Election Board, distributed by the Voting and Election Science Team. Demographic inputs come from the U.S. Census Bureau (ACS 5-year estimates and the 2020 Decennial Census). Health and environmental inputs come from the CDC (PLACES and the Environmental Justice Index). Land cover comes from the USGS and EPA. Election-day and lead-up weather come from PRISM 4km daily grids and the NOAA Global Historical Climatology Network. Mail-voting and election-administration patterns come from the MIT Election Lab's Survey of the Performance of American Elections. Block-group crime detail comes from CrimeGrade. Internet data and modeling support provided by ISPreports.org.
Modeling and analysis by the BestNeighborhood data science team. Full methodology and findings: political spectrum map.
Methodology reviewed by the BestNeighborhood data team. Last updated May 2026.