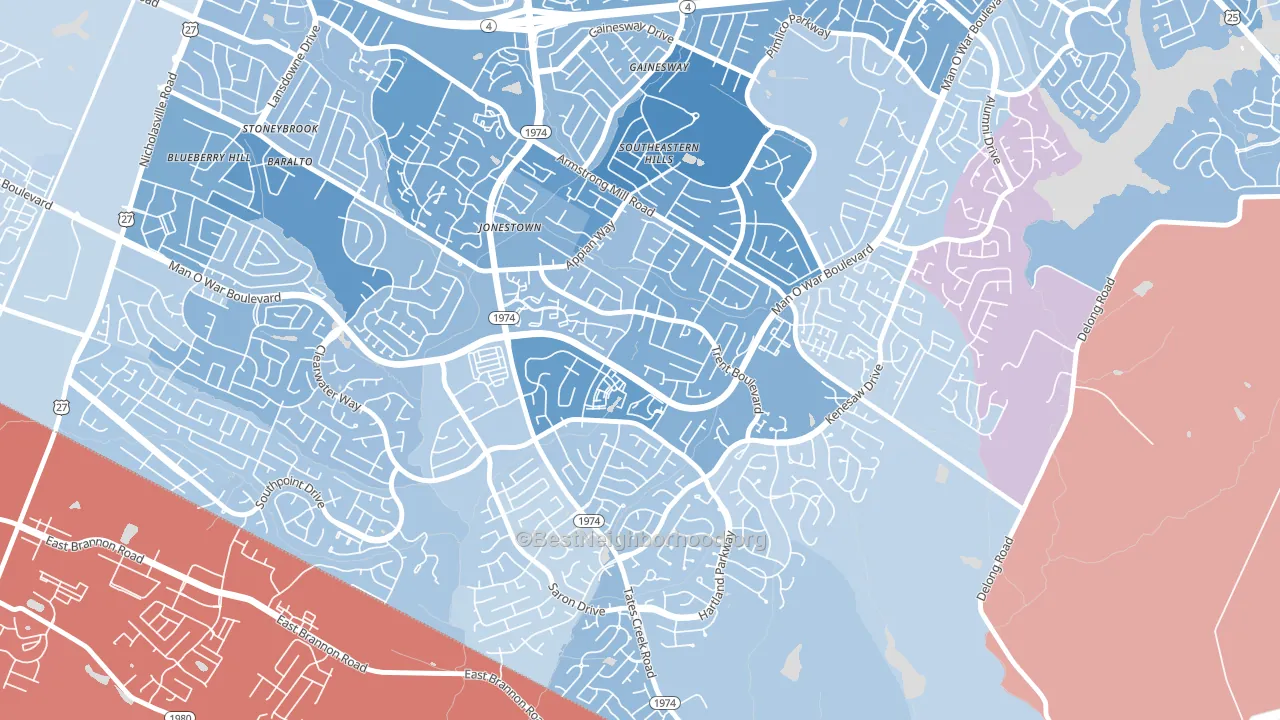
Southeastern Hills leans Democratic by roughly 24 points: about 62% of voters vote Democratic and 38% Republican.
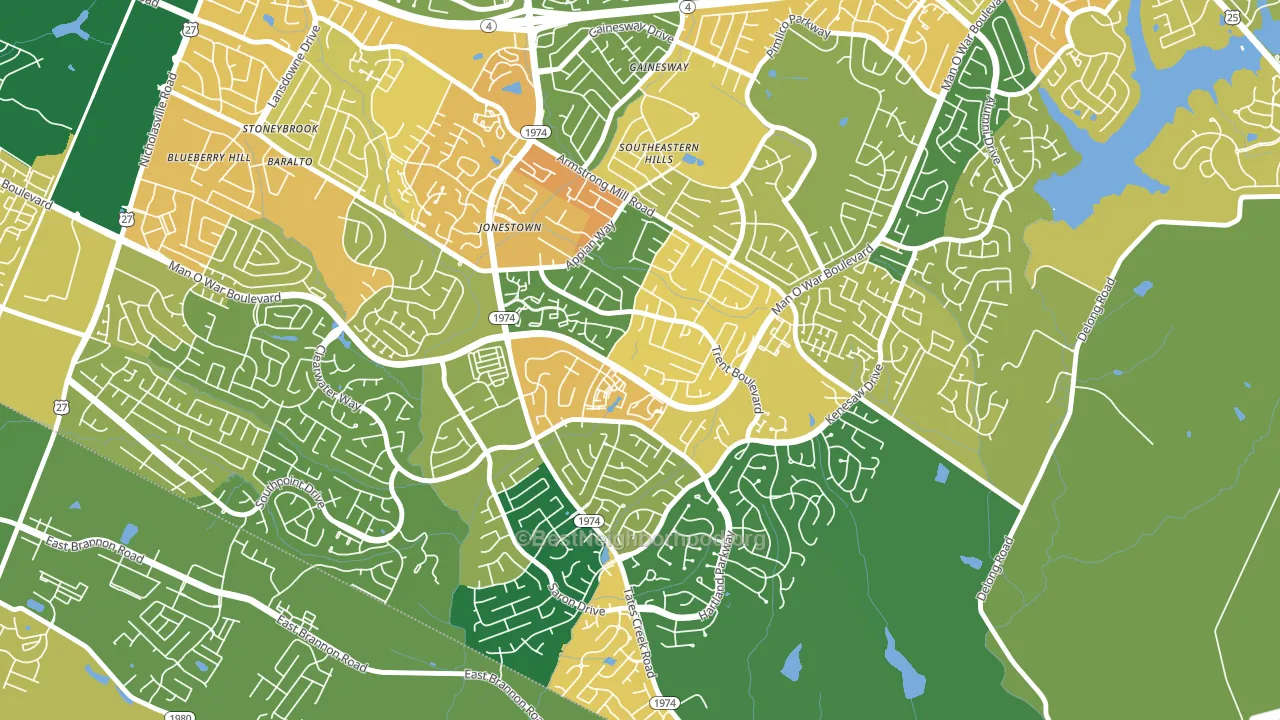
About 56% of adults in Southeastern Hills typically vote, below the U.S. average of about 62%. Among adults in Southeastern Hills, ~35% vote Democratic, ~21% Republican, and ~44% don't vote. The map below shows estimated turnout by block group.
How Southeastern Hills compares
Among neighborhoods within 5 miles, Southeastern Hills leans more Democratic than 2 of 11 neighbors.
Southeastern Hills runs about 55 points more Democratic than Kentucky as a whole. Kentucky leans Republican overall, while Southeastern Hills is one of the few Democratic-leaning pockets.
Politics vary noticeably by block within Southeastern Hills. The northeast side is the most Democratic-leaning (D+32) and the west side is the least Democratic-leaning (D+16), a spread of about 16 points.
Why Southeastern Hills leans the way it does
This analysis examined 14,881 data points per neighborhood to find what predicts political lean and turnout. The items below are a few correlations that stood out for Southeastern Hills, not a ranked or complete list of what matters most.
Southeastern Hills votes against the grain of Kentucky. Kentucky leans Republican overall, while Southeastern Hills runs about 55 points more Democratic. A high never-married share predicts Democratic voting, and about 47% of adults in Southeastern Hills have never been married, above 76% of neighborhoods.
Population density and Democratic lean
Places with high population density tend to lean Democratic; Southeastern Hills, Lexington, KY sits above the national average on this measure.
Why turnout in Southeastern Hills looks the way it does
Renters vote less often than owners. About 63% of households in Southeastern Hills rent, about 38 points above the U.S. average of 25%. Learn more about the findings and methodology on the political spectrum map.
Nearby Neighborhoods
- Blueberry Hill-Brigadoon-Stoneybrook, Lexington, KY D+28
- Brookhaven-Lansdowne, Lexington, KY D+25
- Reservorir, Lexington, KY D+21
- Idle Hour, Lexington, KY D+35
- Chevy Chase-Ashland Park, Lexington, KY D+44
- Southland Deerfield Open Gates, Lexington, KY D+30
- Indian Hills-Stonewall Estates-Monticello, Lexington, KY D+5
- Mount Vernon-Hollywood-Montclair, Lexington, KY D+54
- University of Kentucky, Lexington, KY D+52
- Fairway-Liberty Heights, Lexington, KY D+43
Neighborhoods with Similar Populations
- Leimert Park, Los Angeles, CA D+78
- Cypress Station, Houston, TX D+59
- Lynn-Highland Park, Oakland, CA D+62
- Bridgeland, Cypress, TX R+24
- Coulwood West, Charlotte, NC D+42
- East Akron, Akron, OH D+50
- Highlands, Jacksonville, FL D+47
- Harbour Pointe, Mukilteo, WA D+22
- Southwest Bend, Bend, OR D+16
- Pine Point, Springfield, MA D+41
Sources and methodology
Precinct-level voting records used to fit the model come from Kentucky State Board of Elections, distributed by the Voting and Election Science Team. Demographic inputs come from the U.S. Census Bureau (ACS 5-year estimates and the 2020 Decennial Census). Health and environmental inputs come from the CDC (PLACES and the Environmental Justice Index). Land cover comes from the USGS and EPA. Election-day and lead-up weather come from PRISM 4km daily grids and the NOAA Global Historical Climatology Network. Mail-voting and election-administration patterns come from the MIT Election Lab's Survey of the Performance of American Elections. Block-group crime detail comes from CrimeGrade. Internet data and modeling support provided by ISPreports.org.
Modeling and analysis by the BestNeighborhood data science team. Full methodology and findings: political spectrum map.
Methodology reviewed by the BestNeighborhood data team. Last updated May 2026.