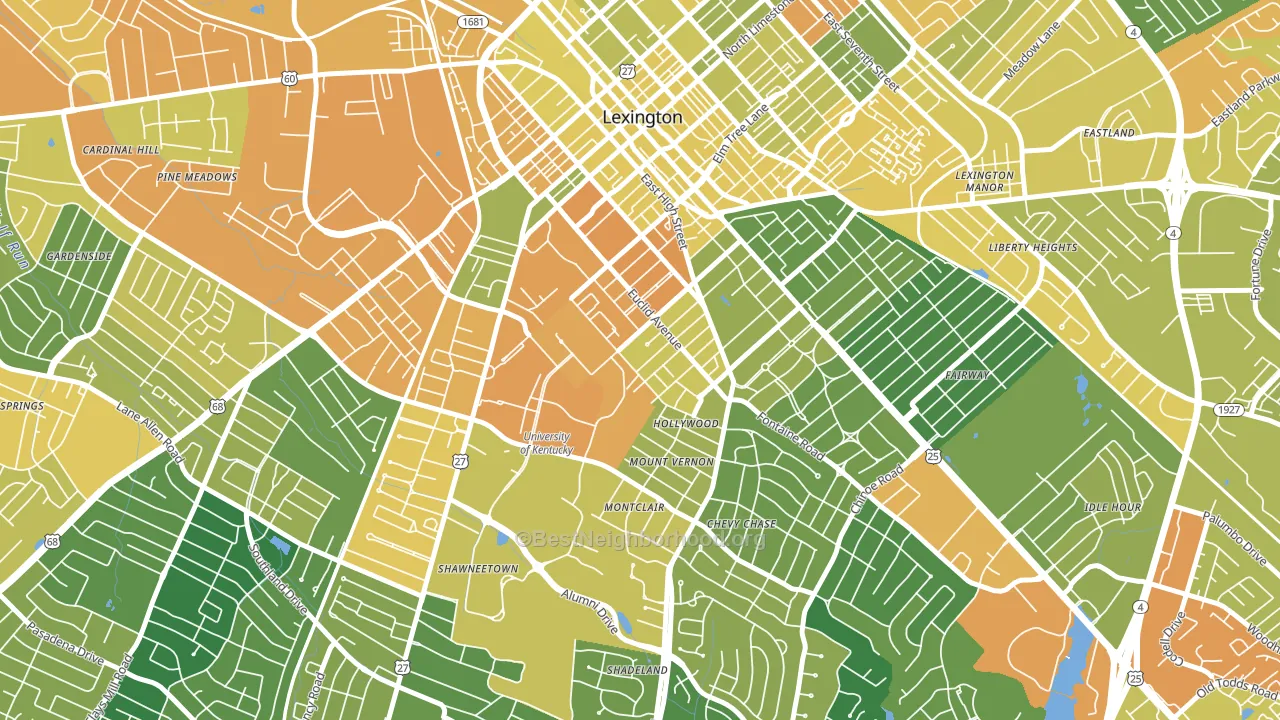
Mount Vernon-Hollywood-Montclair is a Democratic stronghold. About 77% of voters here vote Democratic and 23% Republican.
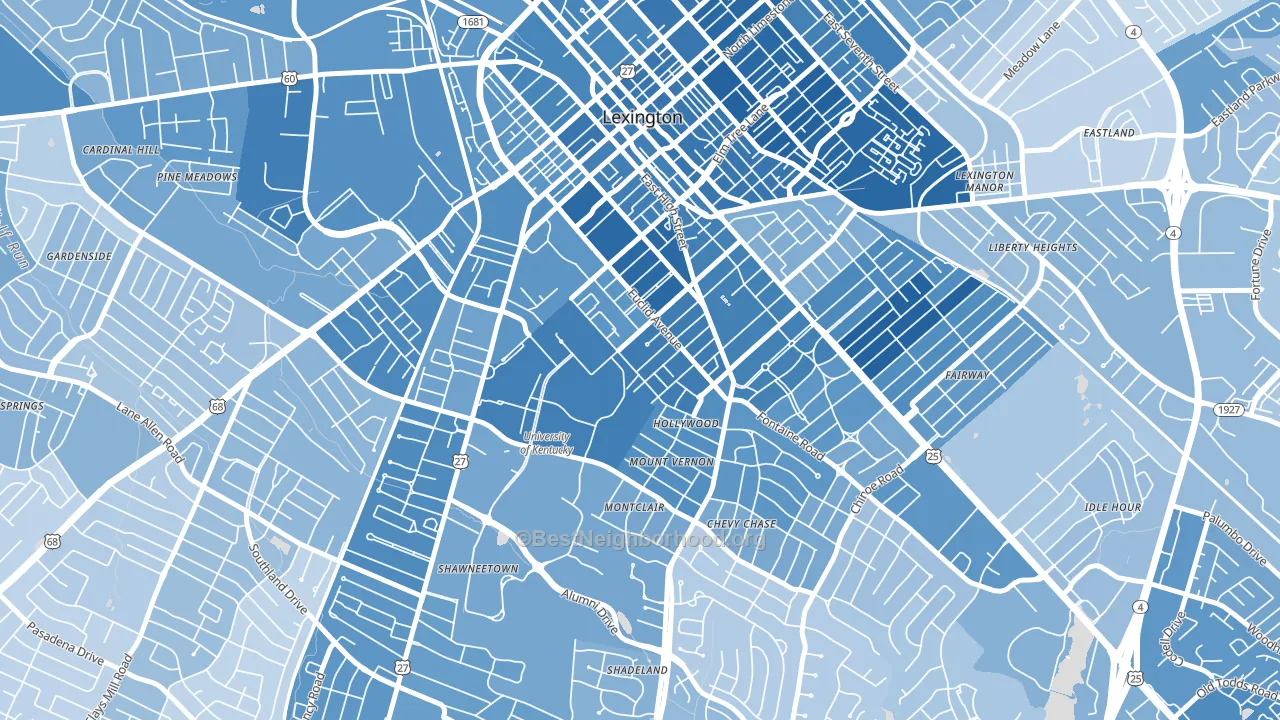
About 49% of adults in Mount Vernon-Hollywood-Montclair typically vote, below the U.S. average of about 62%. Among adults in Mount Vernon-Hollywood-Montclair, ~38% vote Democratic, ~11% Republican, and ~51% don't vote. The map below shows estimated turnout by block group.
How Mount Vernon-Hollywood-Montclair compares
Among neighborhoods within 5 miles, Mount Vernon-Hollywood-Montclair leans more Democratic than 19 of 22 neighbors.
Mount Vernon-Hollywood-Montclair runs about 84 points more Democratic than Kentucky as a whole. Kentucky leans Republican overall, while Mount Vernon-Hollywood-Montclair is one of the few Democratic-leaning pockets.
Politics vary noticeably by block within Mount Vernon-Hollywood-Montclair. The northeast side is the most Democratic-leaning (D+63) and the southeast side is the least Democratic-leaning (D+47), a spread of about 16 points.
Why Mount Vernon-Hollywood-Montclair leans the way it does
This analysis examined 14,881 data points per neighborhood to find what predicts political lean and turnout. The items below are a few correlations that stood out for Mount Vernon-Hollywood-Montclair, not a ranked or complete list of what matters most.
Mount Vernon-Hollywood-Montclair votes against the grain of Kentucky. Kentucky leans Republican overall, while Mount Vernon-Hollywood-Montclair runs about 84 points more Democratic. High college attainment predicts Democratic voting, and Mount Vernon-Hollywood-Montclair sits in the top quarter (about 66%, above 87% of neighborhoods). A high never-married share predicts Democratic voting, and about 80% of adults in Mount Vernon-Hollywood-Montclair have never been married, in the top fraction of neighborhoods.
Walkability and Democratic lean
Places with a highly walkable street grid tend to lean Democratic; Mount Vernon-Hollywood-Montclair, Lexington, KY sits in the top tenth nationally on this measure. A walkable street grid does not change how people vote; it mostly reflects how urban a place is.
Why turnout in Mount Vernon-Hollywood-Montclair looks the way it does
Renters vote less often than owners. About 77% of households in Mount Vernon-Hollywood-Montclair rent, about 52 points above the U.S. average of 25%. Low high-school completion lines up with lower turnout, and about 99% of adults in Mount Vernon-Hollywood-Montclair have completed high school, above 89% of neighborhoods. Learn more about the findings and methodology on the political spectrum map.
Nearby Neighborhoods
- University of Kentucky, Lexington, KY D+52
- Downtown Lexington, Lexington, KY D+55
- Chevy Chase-Ashland Park, Lexington, KY D+44
- Virginia Ave, Lexington, KY D+41
- Fairway-Liberty Heights, Lexington, KY D+43
- Duncan Park, Lexington, KY D+68
- Southland Deerfield Open Gates, Lexington, KY D+30
- Cardinal Hill-Pine Meadow, Lexington, KY D+40
- Reservorir, Lexington, KY D+21
- Castlewood Park, Lexington, KY D+16
Neighborhoods with Similar Populations
- Brookfield Village, Oakland, CA D+58
- Oak Hills, San Antonio, TX D+27
- Sandusky Street Historic District, Delaware, OH D+18
- Pumphrey, Linthicum, MD D+9
- College Hill, Wichita, KS D+29
- Sharon, Orem, UT R+20
- Buckingham Lake-Crestwood, Albany, NY D+47
- Windsor Square, Glendale, AZ Even
- Willow Meadows-Willowbend Area, Houston, TX D+36
- Waltham Highlands, Waltham, MA D+43
Sources and methodology
Precinct-level voting records used to fit the model come from Kentucky State Board of Elections, distributed by the Voting and Election Science Team. Demographic inputs come from the U.S. Census Bureau (ACS 5-year estimates and the 2020 Decennial Census). Health and environmental inputs come from the CDC (PLACES and the Environmental Justice Index). Land cover comes from the USGS and EPA. Election-day and lead-up weather come from PRISM 4km daily grids and the NOAA Global Historical Climatology Network. Mail-voting and election-administration patterns come from the MIT Election Lab's Survey of the Performance of American Elections. Block-group crime detail comes from CrimeGrade. Internet data and modeling support provided by ISPreports.org.
Modeling and analysis by the BestNeighborhood data science team. Full methodology and findings: political spectrum map.
Methodology reviewed by the BestNeighborhood data team. Last updated May 2026.