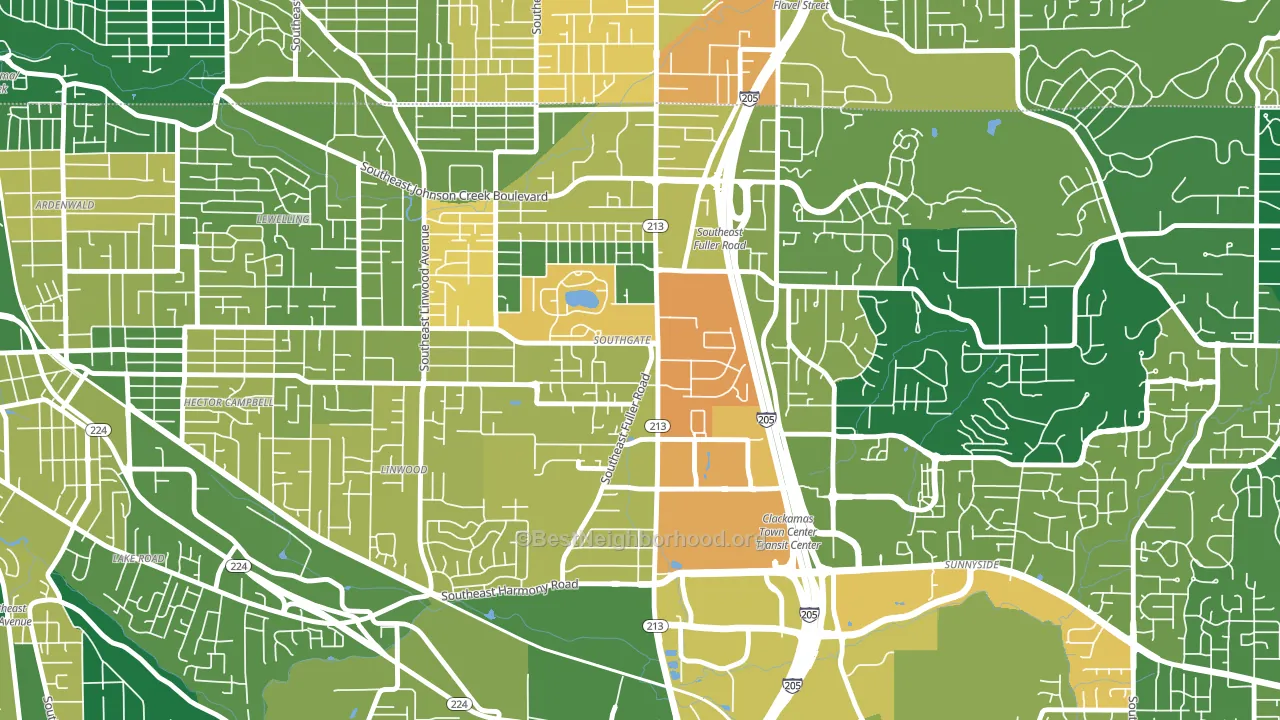
Southgate leans Democratic by roughly 20 points: about 60% of voters vote Democratic and 40% Republican.
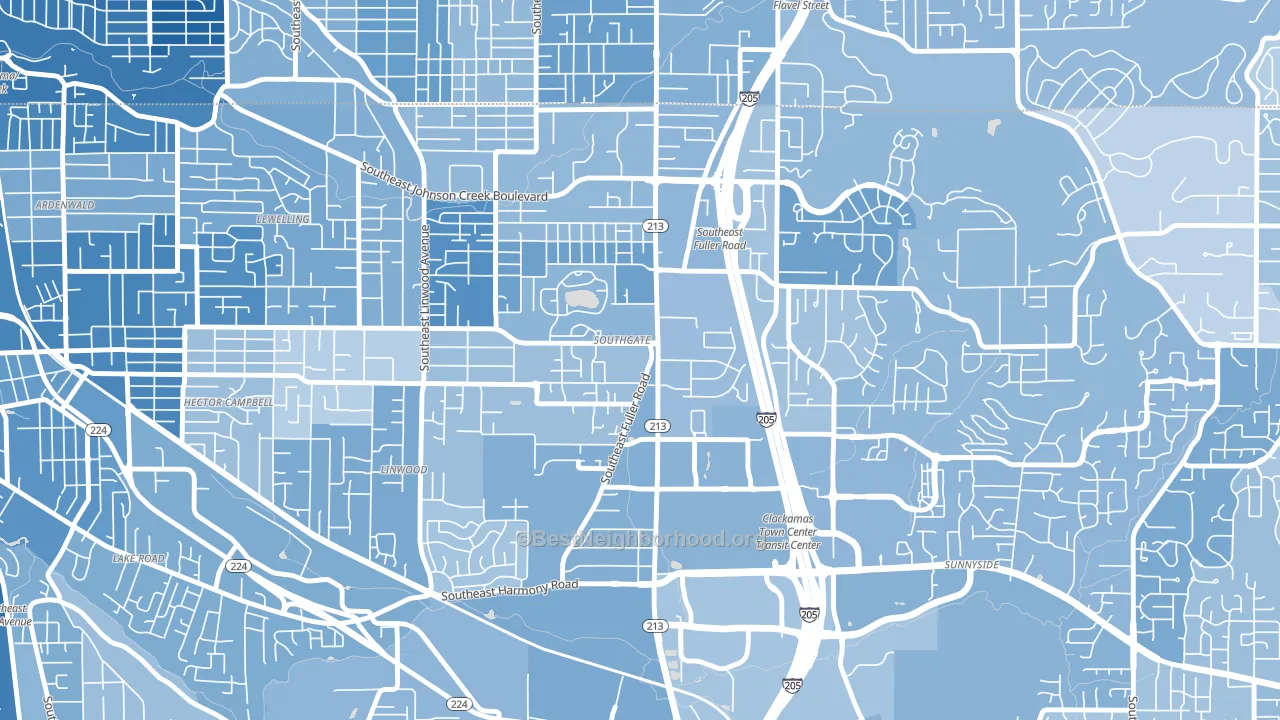
About 52% of adults in Southgate typically vote, below the U.S. average of about 62%. Among adults in Southgate, ~31% vote Democratic, ~21% Republican, and ~48% don't vote. The map below shows estimated turnout by block group.
How Southgate compares
Among neighborhoods within 5 miles, Southgate leans more Democratic than 2 of 26 neighbors.
Southgate runs about 6 points more Democratic than Oregon as a whole.
Why Southgate leans the way it does
Density, race composition, education, and family structure all sit close to their national averages in Southgate. The lean here lands roughly where demographic data alone would predict.
Paved land cover and Democratic lean
Places with extensive paved surfaces tend to lean Democratic; Southgate, Portland, OR sits in the top tenth nationally on this measure. Paved ground does not change how people vote; it mostly reflects how urban and built-up a place is.
Why turnout in Southgate looks the way it does
Renters vote less often than owners. About 68% of households in Southgate rent, about 43 points above the U.S. average of 25%. Learn more about the findings and methodology on the political spectrum map.
Nearby Neighborhoods
- Linwood, Milwaukie, OR D+25
- West Mt. Scott, Happy Valley, OR D+23
- Lewelling, Milwaukie, OR D+39
- Brentwood-Darlington, Portland, OR D+37
- Errol Heights, Portland, OR D+43
- Sunnyside, Clackamas, OR D+26
- Lake Road, Milwaukie, OR D+40
- Ardenwald, Milwaukie, OR D+48
- Lents, Portland, OR D+33
- Mount Scott, Portland, OR D+70
Neighborhoods with Similar Populations
- Pinehurst, Everett, WA D+27
- Wakefield Park, Annandale, VA D+35
- Mount Pleasant, Washington, DC D+83
- Schiller Park, Buffalo, NY D+72
- Near East, Dallas, TX D+24
- Deer Park, Newport News, VA D+35
- North Los Altos, Los Altos, CA D+45
- New City, Chicago, IL D+54
- Huffman-O'Malley, Anchorage, AK D+18
- Broadway Junction, Brooklyn, NY D+65
Sources and methodology
Precinct-level voting records used to fit the model come from Oregon Secretary of State, Elections Division, distributed by the Voting and Election Science Team. Demographic inputs come from the U.S. Census Bureau (ACS 5-year estimates and the 2020 Decennial Census). Health and environmental inputs come from the CDC (PLACES and the Environmental Justice Index). Land cover comes from the USGS and EPA. Election-day and lead-up weather come from PRISM 4km daily grids and the NOAA Global Historical Climatology Network. Mail-voting and election-administration patterns come from the MIT Election Lab's Survey of the Performance of American Elections. Block-group crime detail comes from CrimeGrade. Internet data and modeling support provided by ISPreports.org.
Modeling and analysis by the BestNeighborhood data science team. Full methodology and findings: political spectrum map.
Methodology reviewed by the BestNeighborhood data team. Last updated May 2026.