Sparr Heights leans Democratic by roughly 18 points: about 59% of voters vote Democratic and 41% Republican.
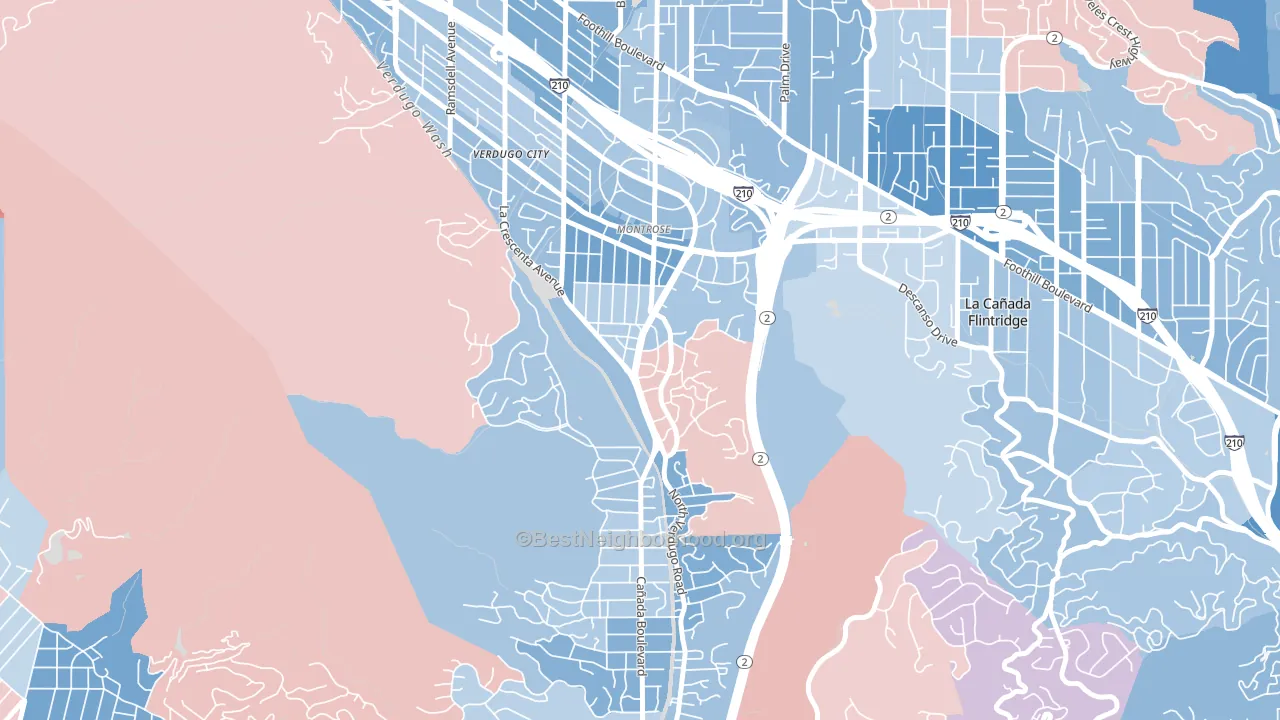
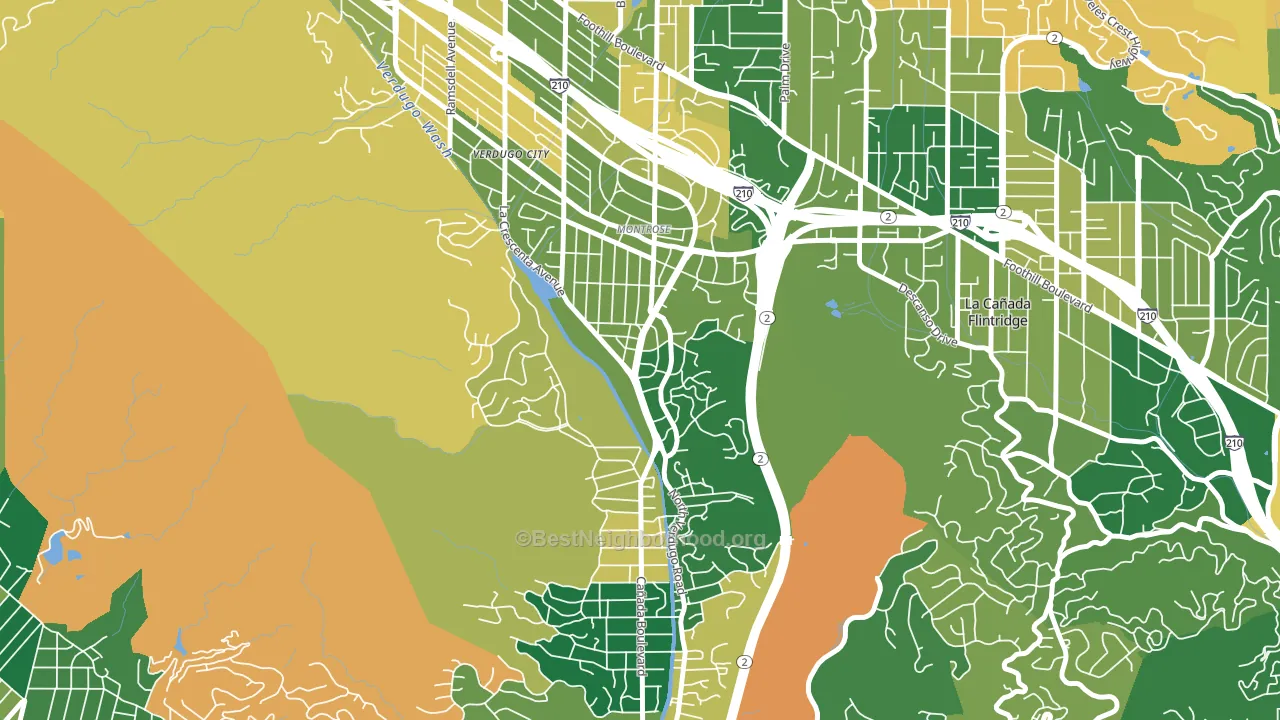
About 83% of adults in Sparr Heights typically vote, above the U.S. average of about 62%. Among adults in Sparr Heights, ~49% vote Democratic, ~34% Republican, and ~17% don't vote. The map below shows estimated turnout by block group.
How Sparr Heights compares
Among neighborhoods within 5 miles, Sparr Heights leans more Democratic than 12 of 20 neighbors.
Politically, Sparr Heights sits close to the rest of California.
Politics vary noticeably by block within Sparr Heights. The north side is the most Democratic-leaning (D+25) and the east side is the least Democratic-leaning (D+12), a spread of about 13 points.
Why Sparr Heights leans the way it does
This analysis examined 14,881 data points per neighborhood to find what predicts political lean and turnout. The items below are a few correlations that stood out for Sparr Heights, not a ranked or complete list of what matters most.
Areas with high college attainment vote Democratic. About 57% of adults in Sparr Heights hold a bachelor's degree, about 29 points above the U.S. average of 28%.
High-school completion, developed land, and voter turnout
Places that combine high-school-completion-heavy adults and a rural land-use pattern tend to turn out at a higher rate, as Sparr Heights, Glendale, CA does.
Why turnout in Sparr Heights looks the way it does
Areas with strong routine healthcare access turn out at higher rates. Sparr Heights is in the top quarter nationally for routine-care measures such as insurance coverage, preventive screenings, and dental visits. The dental-visit rate here is about 74%, about 14 points above the U.S. average of 60%. Learn more about the findings and methodology on the political spectrum map.
Nearby Neighborhoods
- Montrose Verdugo City, La Crescenta, CA D+12
- Verdugo Woodlands, Glendale, CA D+19
- Chevy Chase, Glendale, CA D+3
- Rossmoyne, Glendale, CA D+13
- Verdugo Viejo, Glendale, CA D+15
- Woodbury-Glendale, Glendale, CA D+26
- Crescenta Highlands, La Crescenta, CA D+22
- Glenwood, Glendale, CA D+12
- El Miradero, Glendale, CA D+2
- Fremont Park, Glendale, CA D+12
Neighborhoods with Similar Populations
- Thousand Oaks, San Antonio, TX D+6
- Dam Neck Naval Air Station, Virginia Beach, VA R+3
- Permian Estates, Midland, TX R+42
- Morris Heights, Aurora, CO D+35
- Cardinal Hill-Pine Meadow, Lexington, KY D+40
- Berg-Lasher, Detroit, MI D+88
- North Amherst, Amherst, MA D+75
- Ashton Heights, Arlington, VA D+62
- Upper Land Park, Sacramento, CA D+65
- McClellan Park, Madison, WI D+53
Sources and methodology
Precinct-level voting records used to fit the model come from California Secretary of State, Elections, distributed by the Voting and Election Science Team. Demographic inputs come from the U.S. Census Bureau (ACS 5-year estimates and the 2020 Decennial Census). Health and environmental inputs come from the CDC (PLACES and the Environmental Justice Index). Land cover comes from the USGS and EPA. Election-day and lead-up weather come from PRISM 4km daily grids and the NOAA Global Historical Climatology Network. Mail-voting and election-administration patterns come from the MIT Election Lab's Survey of the Performance of American Elections. Block-group crime detail comes from CrimeGrade. Internet data and modeling support provided by ISPreports.org.
Modeling and analysis by the BestNeighborhood data science team. Full methodology and findings: political spectrum map.
Methodology reviewed by the BestNeighborhood data team. Last updated May 2026.