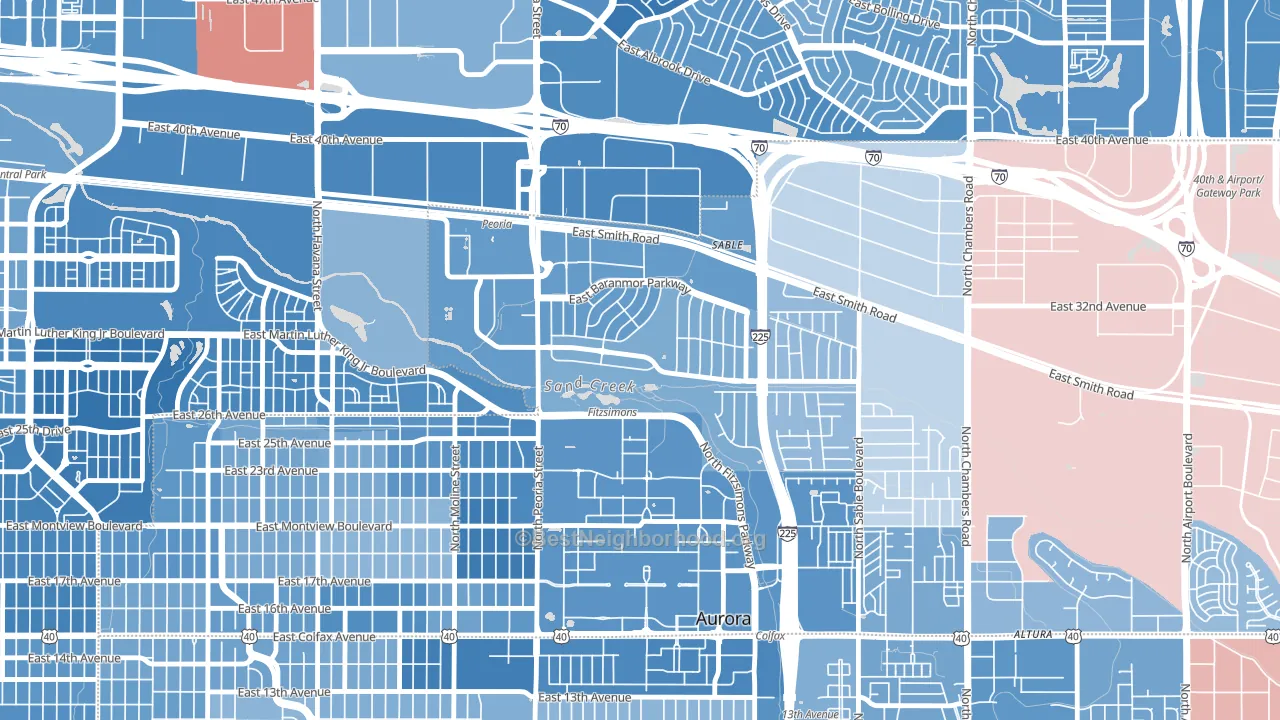
Morris Heights leans heavily Democratic by roughly 34 points: about 67% of voters vote Democratic and 33% Republican.
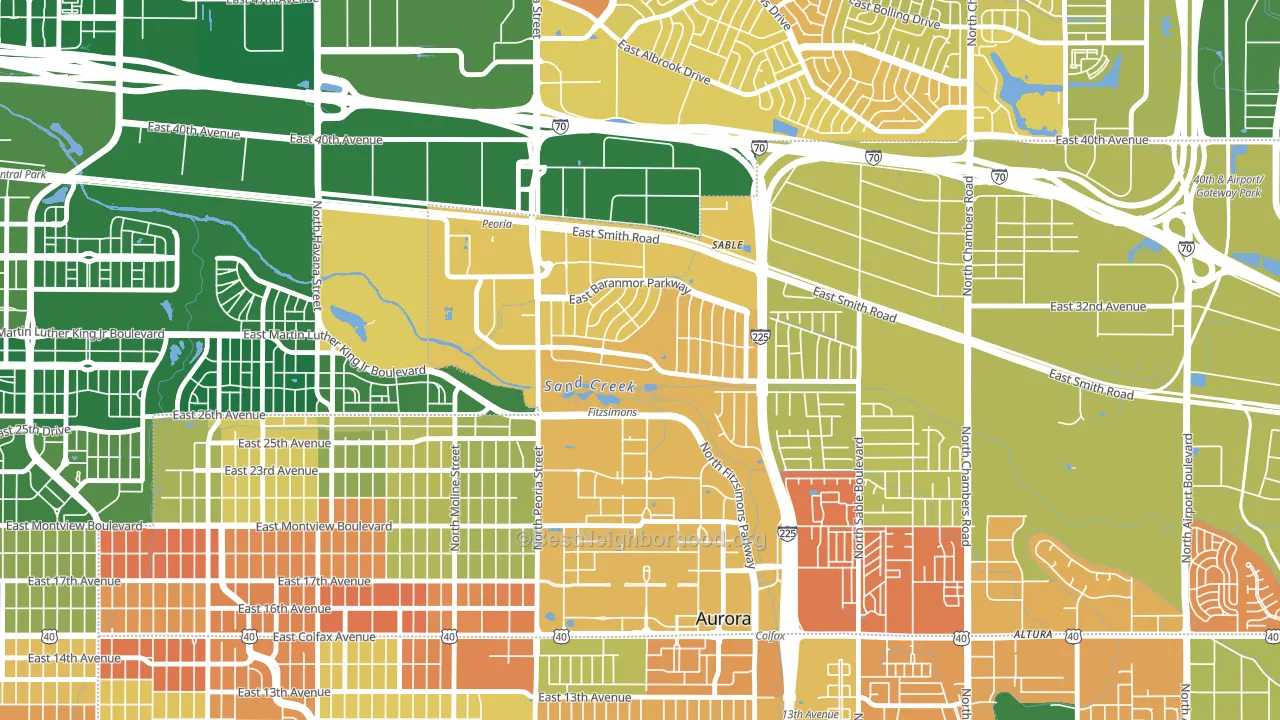
About 47% of adults in Morris Heights typically vote, below the U.S. average of about 62%. Among adults in Morris Heights, ~31% vote Democratic, ~16% Republican, and ~53% don't vote. The map below shows estimated turnout by block group.
How Morris Heights compares
Among neighborhoods within 5 miles, Morris Heights leans more Democratic than 12 of 25 neighbors.
Morris Heights runs about 24 points more Democratic than Colorado as a whole.
Politics vary noticeably by block within Morris Heights. The south side is the most Democratic-leaning (D+50) and the northeast side is the least Democratic-leaning (D+27), a spread of about 23 points.
Why Morris Heights leans the way it does
This analysis examined 14,881 data points per neighborhood to find what predicts political lean and turnout. The items below are a few correlations that stood out for Morris Heights, not a ranked or complete list of what matters most.
Areas with many never-married adults vote Democratic. About 51% of adults in Morris Heights have never been married, modestly above similar-sized neighborhoods (around 42%).
Preventive-care access and voter turnout
Places with limited routine preventive-care access tend to turn out at a lower rate; Morris Heights, Aurora, CO sits below the national average on this measure. Dental visits do not drive turnout; the rate reflects income, insurance, and healthcare access, which line up with who votes.
Why turnout in Morris Heights looks the way it does
Areas with limited routine healthcare access turn out at lower rates. Morris Heights is in the bottom quarter nationally for routine-care measures such as insurance coverage, preventive screenings, and dental visits. The uninsured rate here is about 23%, about 11 points above the Colorado average of 11%. Learn more about the findings and methodology on the political spectrum map.
Nearby Neighborhoods
- Sable Altura Chambers, Aurora, CO D+24
- Jewell Heights-Hoffman Heights, Aurora, CO D+37
- North Aurora, Aurora, CO D+39
- Montebello, Denver, CO D+46
- Chambers Heights, Aurora, CO D+28
- Delmar Parkway, Aurora, CO D+32
- Stapleton, Denver, CO D+56
- Lynn Knoll, Aurora, CO D+30
- Laredo Highline, Aurora, CO D+28
- Highland Park, Aurora, CO D+36
Neighborhoods with Similar Populations
- North Amherst, Amherst, MA D+75
- Cardinal Hill-Pine Meadow, Lexington, KY D+40
- Ashton Heights, Arlington, VA D+62
- Thorpe Westwood, Spokane, WA R+9
- Dam Neck Naval Air Station, Virginia Beach, VA R+3
- Willow Meadows-Willowbend Area, Houston, TX D+36
- Windsor Square, Glendale, AZ Even
- Sparr Heights, Glendale, CA D+18
- Pumphrey, Linthicum, MD D+9
- Thousand Oaks, San Antonio, TX D+6
Sources and methodology
Precinct-level voting records used to fit the model come from Colorado Secretary of State, Elections, distributed by the Voting and Election Science Team. Demographic inputs come from the U.S. Census Bureau (ACS 5-year estimates and the 2020 Decennial Census). Health and environmental inputs come from the CDC (PLACES and the Environmental Justice Index). Land cover comes from the USGS and EPA. Election-day and lead-up weather come from PRISM 4km daily grids and the NOAA Global Historical Climatology Network. Mail-voting and election-administration patterns come from the MIT Election Lab's Survey of the Performance of American Elections. Block-group crime detail comes from CrimeGrade. Internet data and modeling support provided by ISPreports.org.
Modeling and analysis by the BestNeighborhood data science team. Full methodology and findings: political spectrum map.
Methodology reviewed by the BestNeighborhood data team. Last updated May 2026.