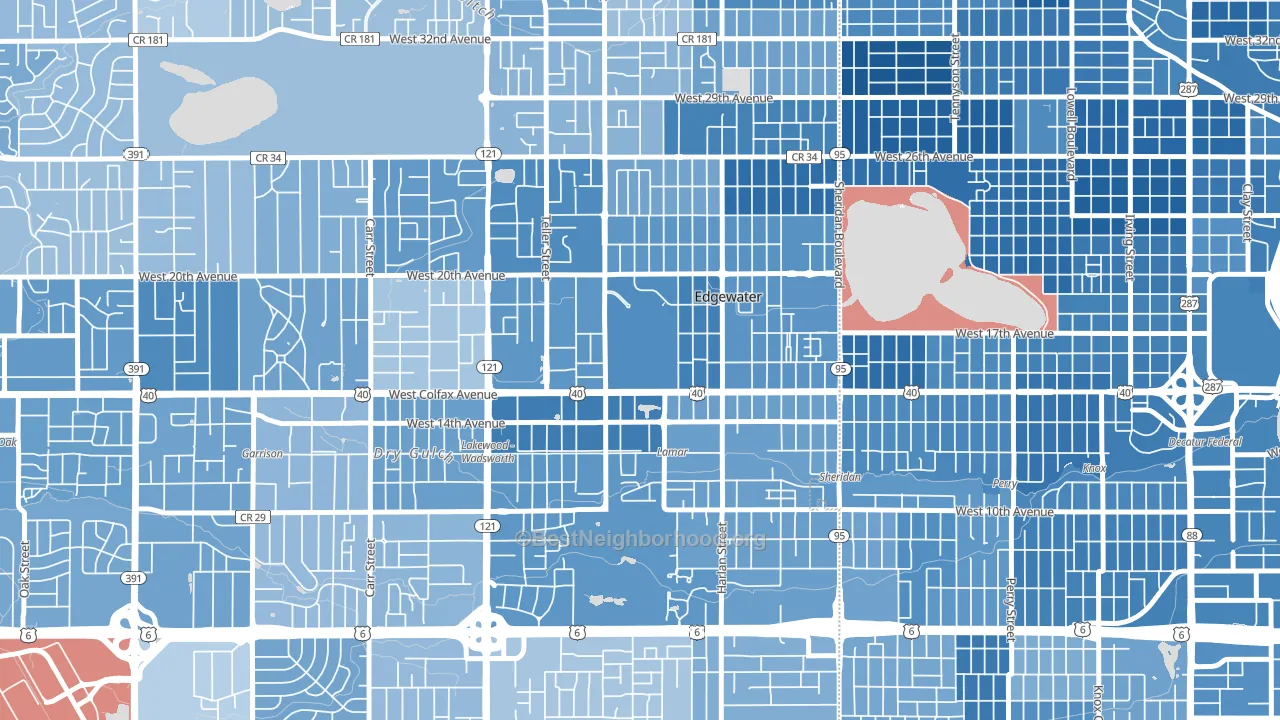
Spivak leans heavily Democratic by roughly 40 points: about 70% of voters vote Democratic and 30% Republican.
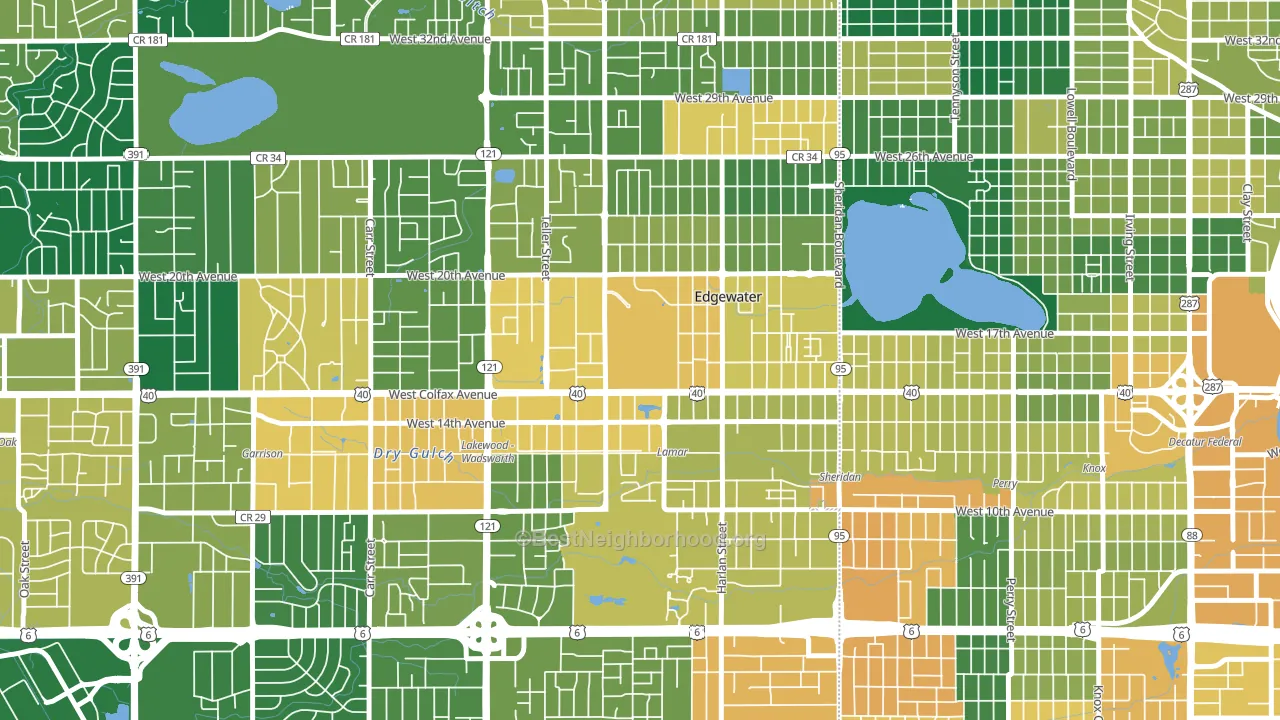
About 53% of adults in Spivak typically vote, below the U.S. average of about 62%. Among adults in Spivak, ~37% vote Democratic, ~16% Republican, and ~47% don't vote. The map below shows estimated turnout by block group.
How Spivak compares
Among neighborhoods within 5 miles, Spivak leans more Democratic than 18 of 39 neighbors.
Spivak runs about 29 points more Democratic than Colorado as a whole.
Why Spivak leans the way it does
This analysis examined 14,881 data points per neighborhood to find what predicts political lean and turnout. The items below are a few correlations that stood out for Spivak, not a ranked or complete list of what matters most.
Dense areas vote Democratic. More than 99% of residents in Spivak live in densely developed areas, about 64 points above the U.S. average of 36%. A high never-married share predicts Democratic voting, and about 59% of adults in Spivak have never been married, above 92% of neighborhoods.
Population density and Democratic lean
Places with high population density tend to lean Democratic; Spivak, Edgewater, CO sits in the top quarter nationally on this measure.
Why turnout in Spivak looks the way it does
High-crime urban areas turn out at lower rates, mostly because the housing stress common in those areas makes voting harder. Spivak sits in the top 15% nationally on a violent-crime measure. See CrimeGrade for more details. Renters vote less often than owners, and about 66% of households in Spivak rent, compared to around 47% in nearby neighborhoods. Learn more about the findings and methodology on the political spectrum map.
Nearby Neighborhoods
- Molholm Two Creeks, Edgewater, CO D+40
- West Colfax, Denver, CO D+51
- North Alameda, Lakewood, CO D+21
- Eiber, Lakewood, CO D+30
- Villa Park, Denver, CO D+52
- Sloan Lake, Denver, CO D+62
- Central West Denver, Denver, CO D+51
- Barnum West, Denver, CO D+40
- West Highland, Denver, CO D+65
- Barths, Wheat Ridge, CO D+36
Neighborhoods with Similar Populations
- Rain Tree, Charlotte, NC D+3
- Olympic West, Longview, WA R+5
- Peacock, Oceanside, CA D+10
- East Terrell Hills, San Antonio, TX D+14
- Westhill, Mobile, AL R+7
- Rock Creek, Cypress, TX R+34
- Molholm Two Creeks, Edgewater, CO D+40
- Brady Gardens, San Antonio, TX D+34
- Brightwood, Springfield, MA D+34
- Masonicus, Mahwah, NJ D+3
Sources and methodology
Precinct-level voting records used to fit the model come from Colorado Secretary of State, Elections, distributed by the Voting and Election Science Team. Demographic inputs come from the U.S. Census Bureau (ACS 5-year estimates and the 2020 Decennial Census). Health and environmental inputs come from the CDC (PLACES and the Environmental Justice Index). Land cover comes from the USGS and EPA. Election-day and lead-up weather come from PRISM 4km daily grids and the NOAA Global Historical Climatology Network. Mail-voting and election-administration patterns come from the MIT Election Lab's Survey of the Performance of American Elections. Block-group crime detail comes from CrimeGrade. Internet data and modeling support provided by ISPreports.org.
Modeling and analysis by the BestNeighborhood data science team. Full methodology and findings: political spectrum map.
Methodology reviewed by the BestNeighborhood data team. Last updated May 2026.