Eiber leans heavily Democratic by roughly 30 points: about 65% of voters vote Democratic and 35% Republican.
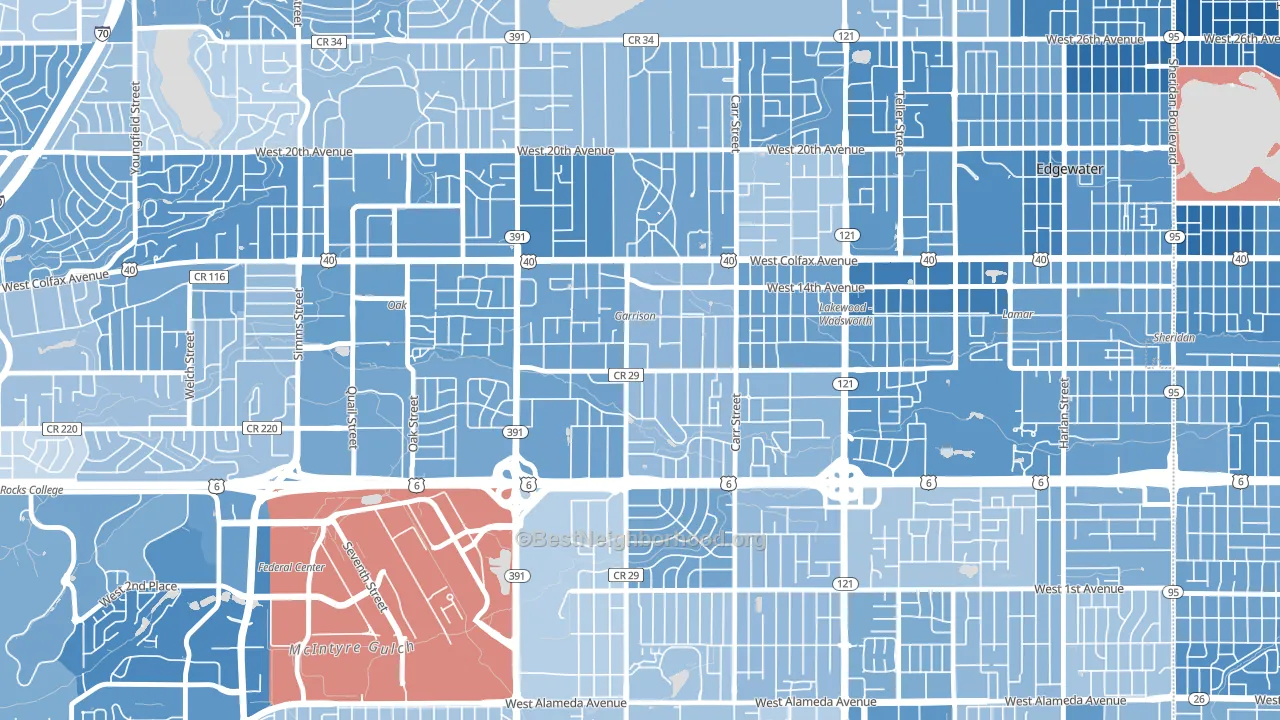
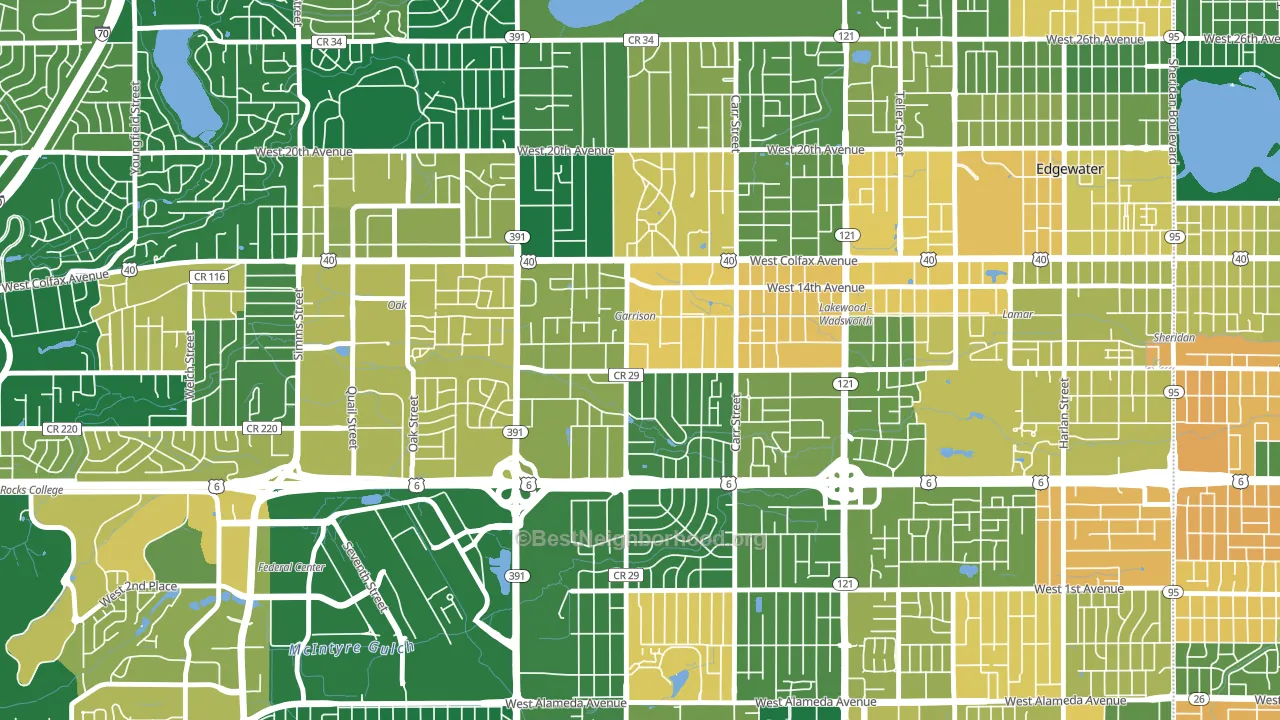
About 66% of adults in Eiber typically vote, near the U.S. average of about 62%. Among adults in Eiber, ~43% vote Democratic, ~23% Republican, and ~34% don't vote. The map below shows estimated turnout by block group.
How Eiber compares
Among neighborhoods within 5 miles, Eiber leans more Democratic than 11 of 30 neighbors.
Eiber runs about 19 points more Democratic than Colorado as a whole.
Politics vary noticeably by block within Eiber. The northeast side is the most Democratic-leaning (D+38) and the south side is the least Democratic-leaning (D+20), a spread of about 18 points.
Why Eiber leans the way it does
This analysis examined 14,881 data points per neighborhood to find what predicts political lean and turnout. The items below are a few correlations that stood out for Eiber, not a ranked or complete list of what matters most.
Dense areas vote Democratic. More than 99% of residents in Eiber live in densely developed areas, about 64 points above the U.S. average of 36%.
Park access and Democratic lean
Places with heavy park coverage tend to lean Democratic; Eiber, Lakewood, CO sits in the top quarter nationally on this measure. Park access does not change how people vote; it tends to track denser, higher-income areas.
Why turnout in Eiber looks the way it does
Turnout in Eiber sits close to the national pattern. Routine healthcare access, homeownership, education, and food security all land near their national averages here. Learn more about the findings and methodology on the political spectrum map.
Nearby Neighborhoods
- Molholm Two Creeks, Edgewater, CO D+40
- Spivak, Edgewater, CO D+40
- North Alameda, Lakewood, CO D+21
- Glennon Heights, Lakewood, CO D+10
- Union Square, Lakewood, CO D+34
- Bel Aire, Wheat Ridge, CO D+23
- Applewood, Lakewood, CO D+26
- South Alameda, Lakewood, CO D+32
- Barnum West, Denver, CO D+40
- Villa Park, Denver, CO D+52
Neighborhoods with Similar Populations
- Jefferson Westside, Eugene, OR D+71
- Central City East, Los Angeles, CA D+41
- North Waltham, Waltham, MA D+33
- Home Gardens, Corona, CA D+6
- Buckingham, Arlington, VA D+52
- Natomas Corporate Center, Sacramento, CA D+16
- Nottingham, Katy, TX R+24
- Wickham, Coralville, IA D+34
- Clinton, Lincoln, NE D+32
- Lane-Wooster, Akron, OH D+78
Sources and methodology
Precinct-level voting records used to fit the model come from Colorado Secretary of State, Elections, distributed by the Voting and Election Science Team. Demographic inputs come from the U.S. Census Bureau (ACS 5-year estimates and the 2020 Decennial Census). Health and environmental inputs come from the CDC (PLACES and the Environmental Justice Index). Land cover comes from the USGS and EPA. Election-day and lead-up weather come from PRISM 4km daily grids and the NOAA Global Historical Climatology Network. Mail-voting and election-administration patterns come from the MIT Election Lab's Survey of the Performance of American Elections. Block-group crime detail comes from CrimeGrade. Internet data and modeling support provided by ISPreports.org.
Modeling and analysis by the BestNeighborhood data science team. Full methodology and findings: political spectrum map.
Methodology reviewed by the BestNeighborhood data team. Last updated May 2026.