Springdale leans Democratic by roughly 20 points: about 60% of voters vote Democratic and 40% Republican.
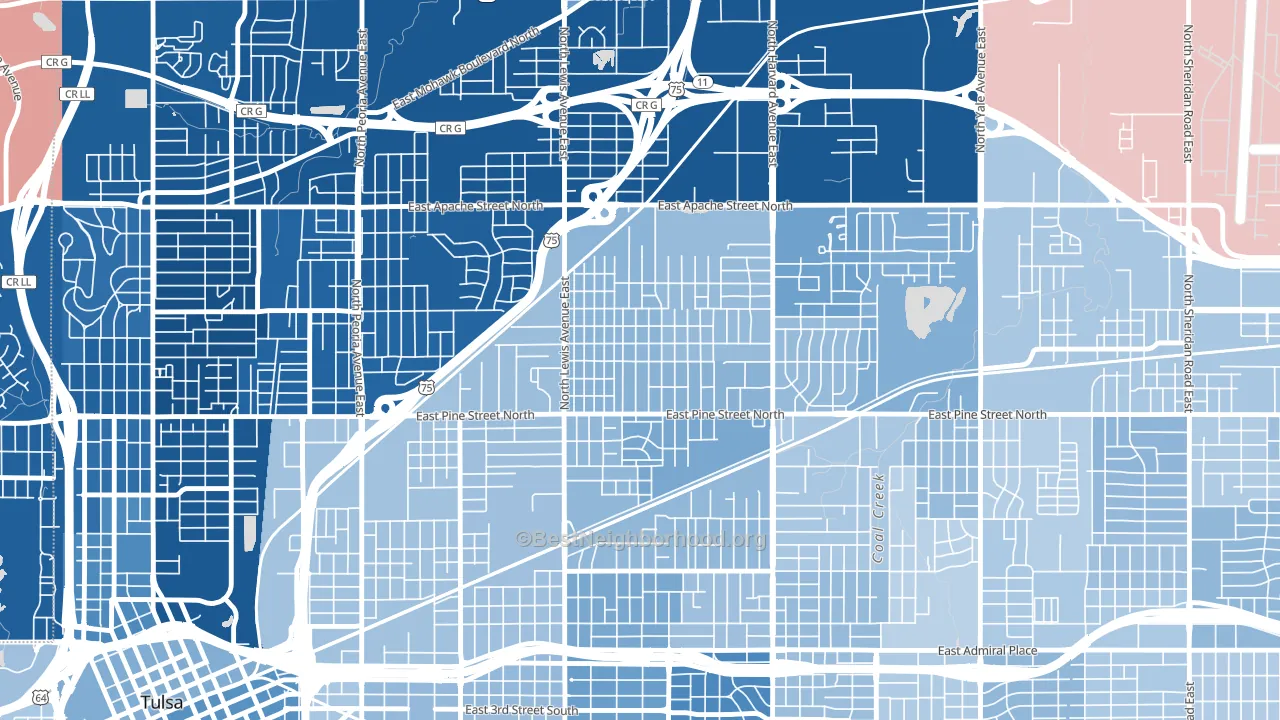
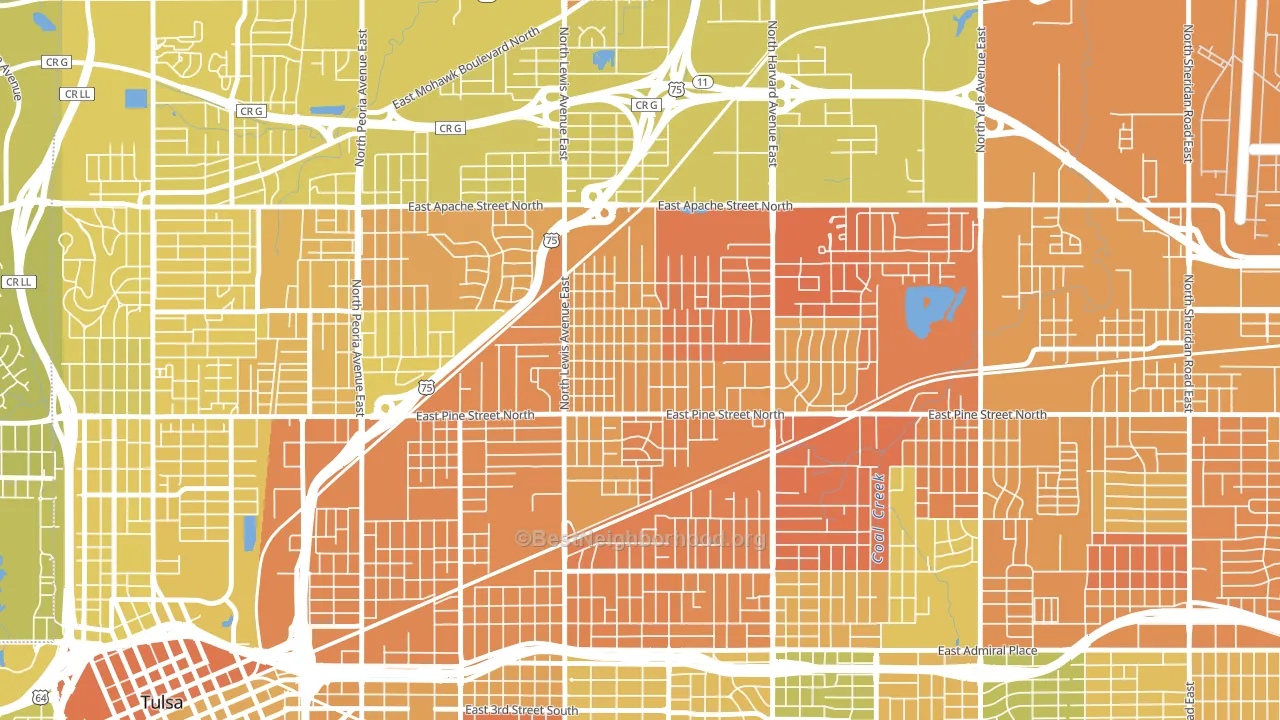
About 25% of adults in Springdale typically vote, below the U.S. average of about 62%. Among adults in Springdale, ~15% vote Democratic, ~10% Republican, and ~75% don't vote. The map below shows estimated turnout by block group.
How Springdale compares
Among neighborhoods within 5 miles, Springdale leans more Democratic than 6 of 9 neighbors.
Springdale runs about 69 points more Democratic than Oklahoma as a whole. Oklahoma leans Republican overall, while Springdale is one of the few Democratic-leaning pockets.
Why Springdale leans the way it does
This analysis examined 14,881 data points per neighborhood to find what predicts political lean and turnout. The items below are a few correlations that stood out for Springdale, not a ranked or complete list of what matters most.
Dense areas vote Democratic. More than 99% of residents in Springdale live in densely developed areas, about 64 points above the U.S. average of 36%. Springdale runs against the grain of Oklahoma, a Democratic-leaning pocket in a Republican-leaning state.
Cancer-screening access and voter turnout
Places with low colon-cancer-screening access tend to turn out at a lower rate; Springdale, Tulsa, OK sits in the bottom tenth nationally on this measure. Cancer screening does not drive turnout; it reflects income, insurance, and healthcare access.
Why turnout in Springdale looks the way it does
Areas with limited routine healthcare access turn out at lower rates. Springdale is in the bottom quarter nationally for routine-care measures such as insurance coverage, preventive screenings, and dental visits. The dental-visit rate here is about 33%, about 22 points below the Oklahoma average of 55%. High food insecurity lines up with lower turnout, and about 49% of adults in Springdale report food insecurity, above 98% of neighborhoods. Low high-school completion lines up with lower turnout, and about 61% of adults in Springdale have completed high school, below 98% of neighborhoods. Learn more about the findings and methodology on the political spectrum map.
Nearby Neighborhoods
- Sequoyah, Tulsa, OK D+11
- Maxwell, Tulsa, OK D+7
- Turner Park, Tulsa, OK D+19
- McKinley Mitchell, Tulsa, OK D+11
- Downtown Tulsa, Tulsa, OK D+44
- Gilcrease Hills, Tulsa, OK D+76
- McClure Park, Tulsa, OK D+3
- Mayo Meadow, Tulsa, OK D+18
- Riverview Park, Tulsa, OK D+41
- Brookside, Tulsa, OK D+16
Neighborhoods with Similar Populations
- Ridgewood Junction, Glen Rock, NJ D+21
- Valhalla, Milwaukee, WI D+79
- Burkhardt, Dayton, OH D+2
- Greenwood, Warwick, RI Even
- Cooper Park, Milwaukee, WI D+47
- Ridgeview Estates, Bakersfield, CA R+12
- Pimmit Hills, Falls Church, VA D+33
- Mesa Forest, Austin, TX D+44
- San Pedro, Robstown, TX D+19
- Old Palo Alto, Palo Alto, CA D+69
Sources and methodology
Precinct-level voting records used to fit the model come from Oklahoma State Election Board, distributed by the Voting and Election Science Team. Demographic inputs come from the U.S. Census Bureau (ACS 5-year estimates and the 2020 Decennial Census). Health and environmental inputs come from the CDC (PLACES and the Environmental Justice Index). Land cover comes from the USGS and EPA. Election-day and lead-up weather come from PRISM 4km daily grids and the NOAA Global Historical Climatology Network. Mail-voting and election-administration patterns come from the MIT Election Lab's Survey of the Performance of American Elections. Block-group crime detail comes from CrimeGrade. Internet data and modeling support provided by ISPreports.org.
Modeling and analysis by the BestNeighborhood data science team. Full methodology and findings: political spectrum map.
Methodology reviewed by the BestNeighborhood data team. Last updated May 2026.