The Rock is a Republican stronghold. About 14% of voters here vote Democratic and 86% Republican.
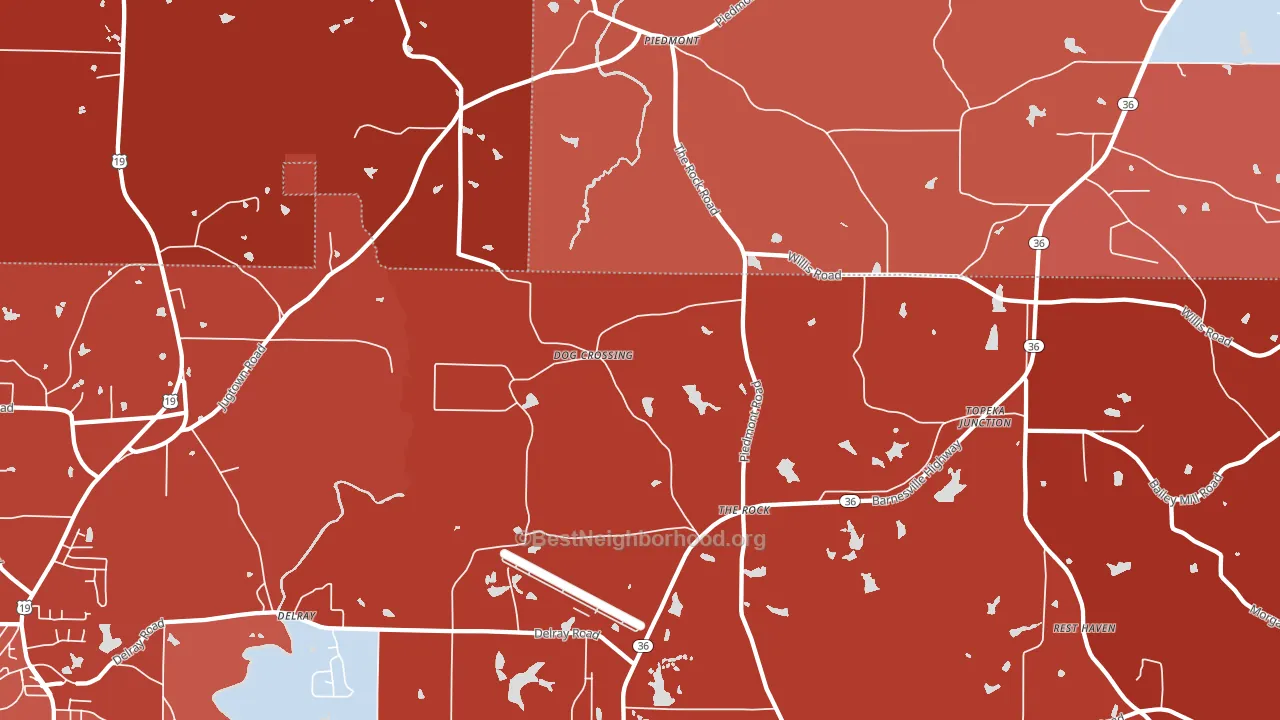
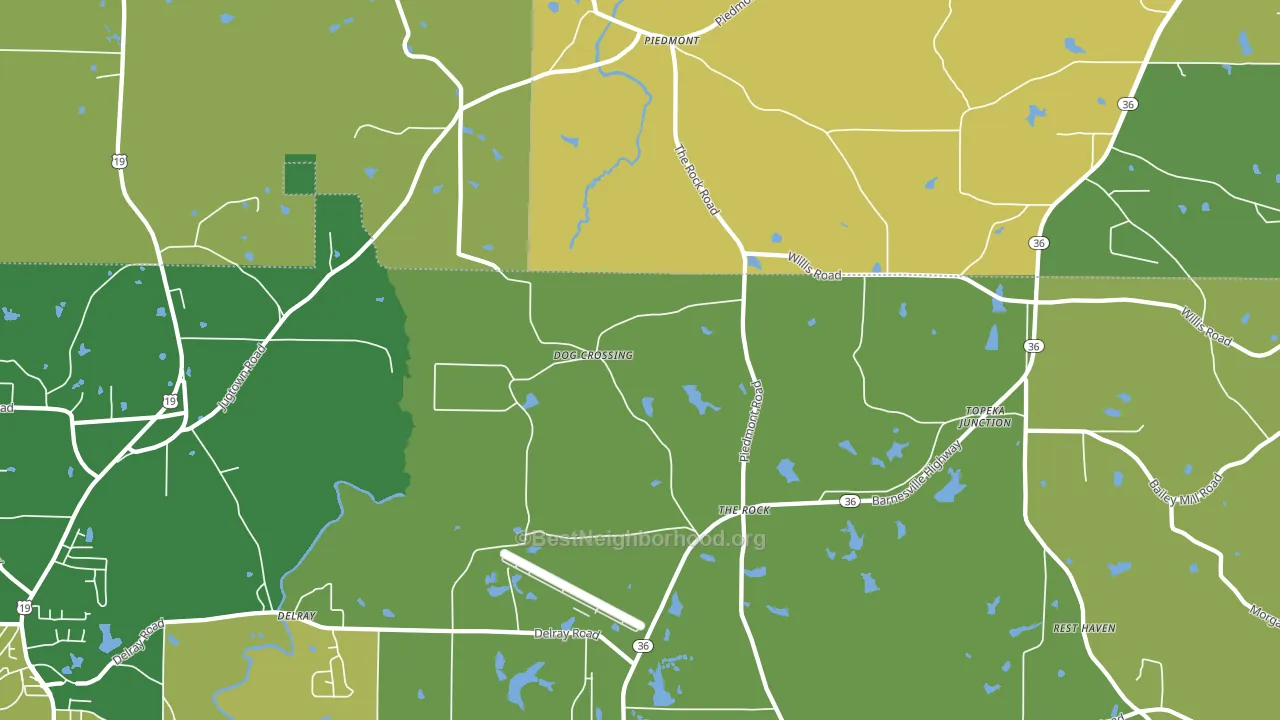
About 77% of adults in The Rock typically vote, above the U.S. average of about 62%. Among adults in The Rock, ~11% vote Democratic, ~66% Republican, and ~23% don't vote. The map below shows estimated turnout by block group.
How The Rock compares
Among cities within 25 miles, The Rock leans more Republican than 53 of 62 neighbors.
The Rock runs about 70 points more Republican than Georgia as a whole.
Politics vary noticeably by neighborhood within The Rock. The west side is the most Republican-leaning (R+73) and the northeast side is the least Republican-leaning (R+55), a spread of about 18 points.
Why The Rock leans the way it does
This analysis examined 14,881 data points per city to find what predicts political lean and turnout. The items below are a few correlations that stood out for The Rock, not a ranked or complete list of what matters most.
Car-dependent areas vote Republican. About 93% of residents in The Rock drive to work alone, about 20 points above the U.S. average of 74%. Low college attainment predicts Republican voting, and The Rock sits in the bottom quarter (about 14%, below 82% of cities).
Never-married share and voter turnout
Places with a low never-married share tend to turn out at a higher rate; The Rock, GA sits in the bottom quarter nationally on this measure.
Why turnout in The Rock looks the way it does
Turnout in The Rock sits close to the national pattern. Learn more about the findings and methodology on the political spectrum map.
Nearby Cities
- McKinney, GA R+42
- Piedmont, GA R+63
- Topeka Junction, GA R+73
- Vega, GA R+75
- Hannahs Mill, GA R+75
- Meansville, GA R+76
- Rose Hill, GA R+77
- Milner Crossroads, GA R+53
- Thomaston, GA R+25
Cities with Similar Populations
- Brooklin, ME D+17
- Ashley Falls, MA D+11
- Lincoln Center, ME R+30
- Idlewild, MI D+3
- Stone Church, NY R+38
- Richmond Corner, ME R+17
- Groveland, CA R+20
- Brenton, WV R+72
- Cantrall, IL R+38
- Lewiston Woodville, NC D+64
Sources and methodology
Precinct-level voting records used to fit the model come from Georgia Elections Division, distributed by the Voting and Election Science Team. Demographic inputs come from the U.S. Census Bureau (ACS 5-year estimates and the 2020 Decennial Census). Health and environmental inputs come from the CDC (PLACES and the Environmental Justice Index). Land cover comes from the USGS and EPA. Election-day and lead-up weather come from PRISM 4km daily grids and the NOAA Global Historical Climatology Network. Mail-voting and election-administration patterns come from the MIT Election Lab's Survey of the Performance of American Elections. Block-group crime detail comes from CrimeGrade. Internet data and modeling support provided by ISPreports.org.
Modeling and analysis by the BestNeighborhood data science team. Full methodology and findings: political spectrum map.
Methodology reviewed by the BestNeighborhood data team. Last updated May 2026.