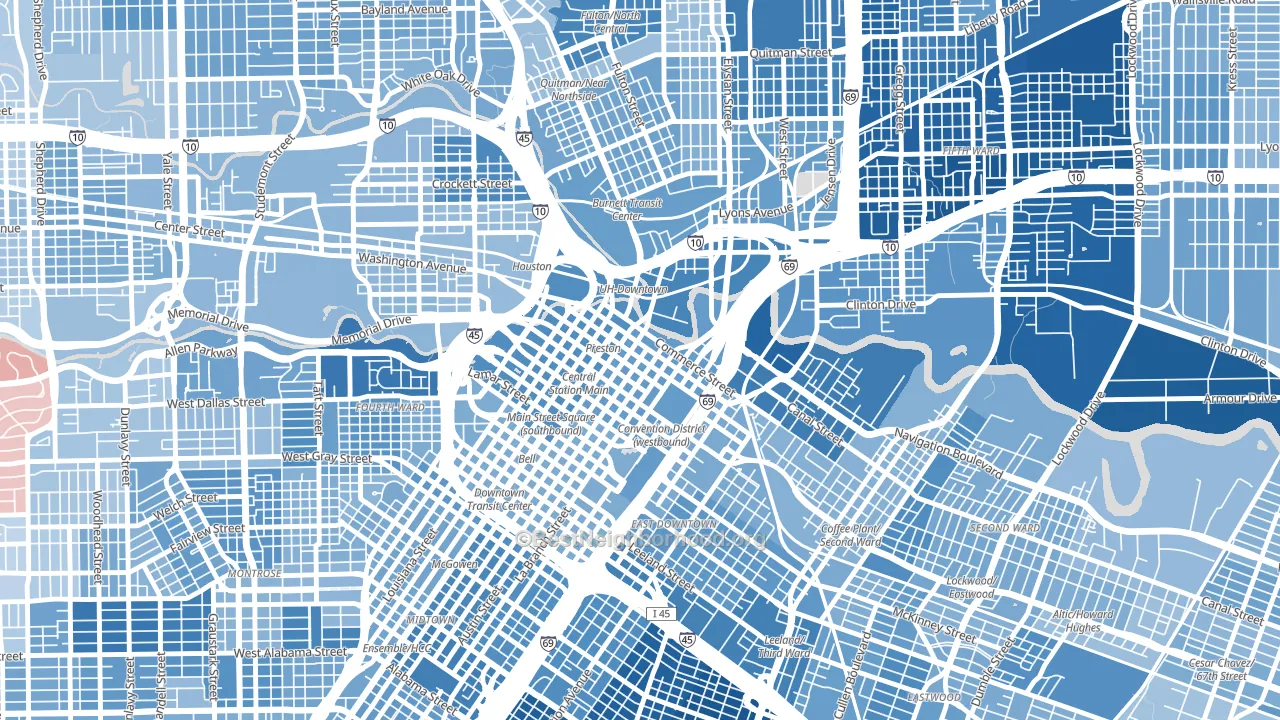
Downtown Houston leans heavily Democratic by roughly 50 points: about 75% of voters vote Democratic and 25% Republican.
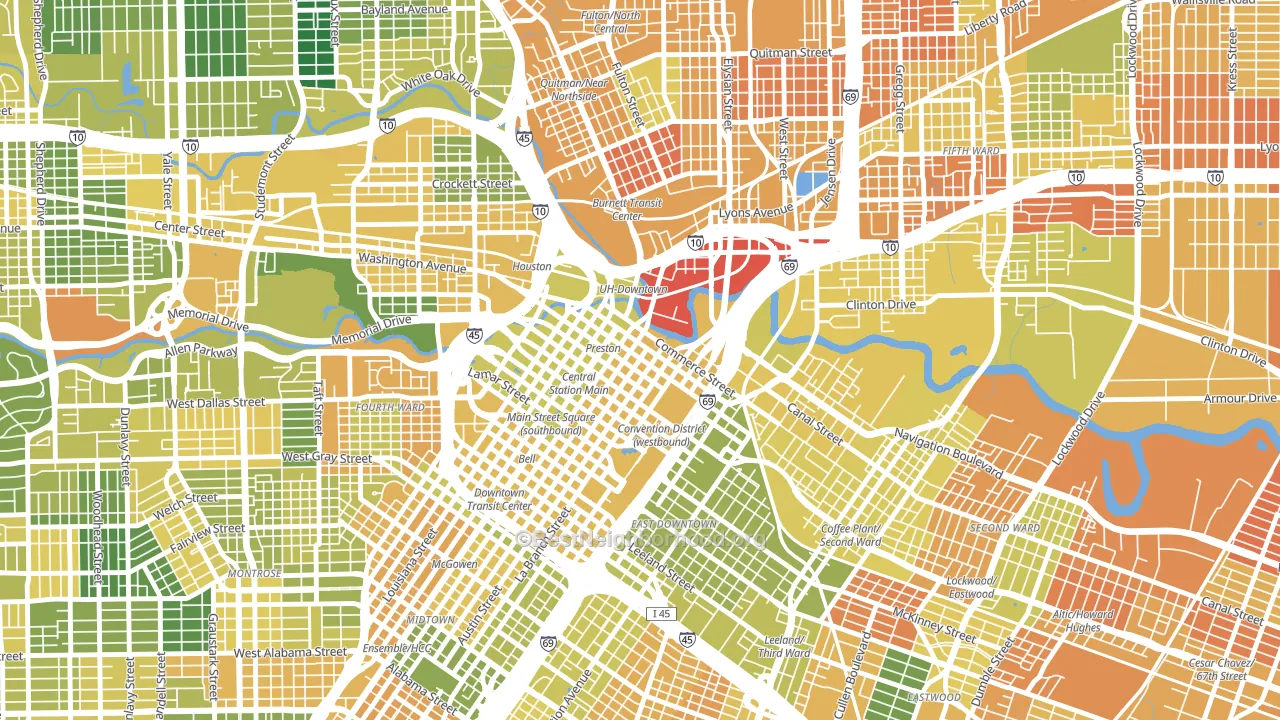
About 28% of adults in Downtown Houston typically vote, below the U.S. average of about 62%. Among adults in Downtown Houston, ~21% vote Democratic, ~7% Republican, and ~72% don't vote. The map below shows estimated turnout by block group.
How Downtown Houston compares
Among neighborhoods within 5 miles, Downtown Houston leans more Democratic than 10 of 12 neighbors.
Downtown Houston runs about 63 points more Democratic than Texas as a whole. Texas leans Republican overall, while Downtown Houston is one of the few Democratic-leaning pockets.
Politics vary noticeably by block within Downtown Houston. The northeast side is the most Democratic-leaning (D+55) and the southeast side is the least Democratic-leaning (D+36), a spread of about 19 points.
Why Downtown Houston leans the way it does
This analysis examined 14,881 data points per neighborhood to find what predicts political lean and turnout. The items below are a few correlations that stood out for Downtown Houston, not a ranked or complete list of what matters most.
Downtown Houston votes against the grain of Texas. Texas leans Republican overall, while Downtown Houston runs about 63 points more Democratic. Density combined with diversity predicts Democratic voting, and non-Hispanic white share in Downtown Houston is about 33%, about 39 points below the U.S. average of 72%. A high never-married share predicts Democratic voting, and about 65% of adults in Downtown Houston have never been married, above 96% of neighborhoods.
Walkability and Democratic lean
Places with a highly walkable street grid tend to lean Democratic; Downtown Houston, Houston, TX sits in the top quarter nationally on this measure. A walkable street grid does not change how people vote; it mostly reflects how urban a place is.
Why turnout in Downtown Houston looks the way it does
Areas with limited routine healthcare access turn out at lower rates. Downtown Houston is in the bottom quarter nationally for routine-care measures such as insurance coverage, preventive screenings, and dental visits. Renters vote less often than owners, and about 88% of households in Downtown Houston rent, compared to around 57% in nearby neighborhoods. High-crime urban areas turn out at lower rates, and Downtown Houston sits in the top 15% on a violent-crime measure. Learn more about the findings and methodology on the political spectrum map.
Nearby Neighborhoods
- Fourth Ward, Houston, TX D+47
- Midtown, Houston, TX D+42
- Greater Fifth Ward, Houston, TX D+63
- Washington Avenue-Memorial Park, Houston, TX D+23
- Montrose, Houston, TX D+39
- Rice Military, Houston, TX D+22
- East End, Houston, TX D+31
- Kashmere Gardens, Houston, TX D+70
- Greater Heights, Houston, TX D+24
- Denver Harbor-Port Houston, Houston, TX D+29
Neighborhoods with Similar Populations
- Oleander Sunset, Bakersfield, CA D+17
- West Boulevard, Cleveland, OH D+30
- Whitmer-Trilby, Toledo, OH D+2
- Pacific Heights, San Francisco, CA D+69
- South West, Washington, DC D+76
- North Collinwood, Cleveland, OH D+71
- First Hill, Seattle, WA D+69
- Business District, Irvine, CA D+16
- Roland Park-Homewood-Guilford, Baltimore, MD D+67
- Chisholm Creek, Wichita, KS D+9
Sources and methodology
Precinct-level voting records used to fit the model come from Texas Secretary of State, Elections Division, distributed by the Voting and Election Science Team. Demographic inputs come from the U.S. Census Bureau (ACS 5-year estimates and the 2020 Decennial Census). Health and environmental inputs come from the CDC (PLACES and the Environmental Justice Index). Land cover comes from the USGS and EPA. Election-day and lead-up weather come from PRISM 4km daily grids and the NOAA Global Historical Climatology Network. Mail-voting and election-administration patterns come from the MIT Election Lab's Survey of the Performance of American Elections. Block-group crime detail comes from CrimeGrade. Internet data and modeling support provided by ISPreports.org.
Modeling and analysis by the BestNeighborhood data science team. Full methodology and findings: political spectrum map.
Methodology reviewed by the BestNeighborhood data team. Last updated May 2026.