Upper East Side is a Democratic stronghold. About 79% of voters here vote Democratic and 21% Republican.
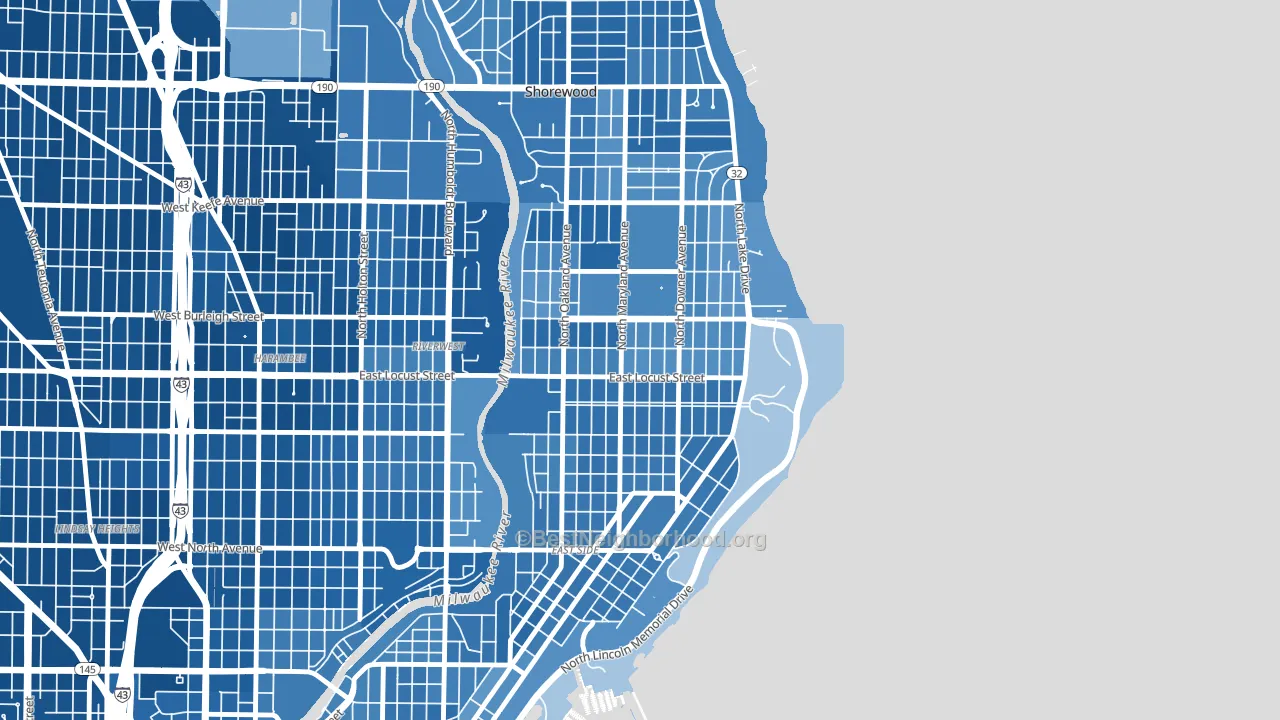
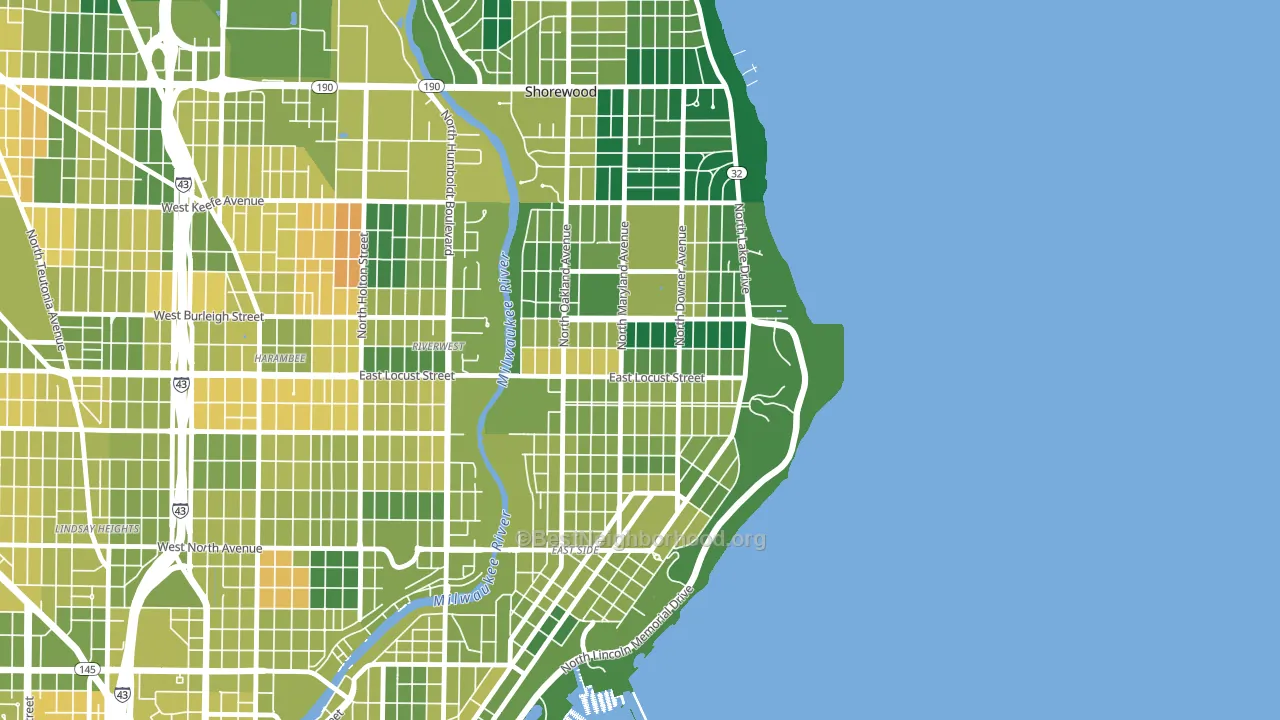
About 79% of adults in Upper East Side typically vote, above the U.S. average of about 62%. Among adults in Upper East Side, ~62% vote Democratic, ~17% Republican, and ~21% don't vote. The map below shows estimated turnout by block group.
How Upper East Side compares
Among neighborhoods within 5 miles, Upper East Side leans more Democratic than 9 of 30 neighbors.
Upper East Side runs about 59 points more Democratic than Wisconsin as a whole. Wisconsin is roughly evenly split, and Upper East Side sits clearly on the Democratic side.
Politics vary noticeably by block within Upper East Side. The southwest side is the most Democratic-leaning (D+64) and the east side is the least Democratic-leaning (D+53), a spread of about 11 points.
Why Upper East Side leans the way it does
This analysis examined 14,881 data points per neighborhood to find what predicts political lean and turnout. The items below are a few correlations that stood out for Upper East Side, not a ranked or complete list of what matters most.
Areas with high college attainment vote Democratic. About 69% of adults in Upper East Side hold a bachelor's degree, about 41 points above the U.S. average of 28%. A high never-married share predicts Democratic voting, and about 65% of adults in Upper East Side have never been married, above 96% of neighborhoods. Upper East Side runs against the grain of Wisconsin, a Democratic-leaning outlier in a roughly evenly split state.
Paved land cover and Democratic lean
Places with extensive paved surfaces tend to lean Democratic; Upper East Side, Milwaukee, WI sits in the top quarter nationally on this measure. Paved ground does not change how people vote; it mostly reflects how urban and built-up a place is.
Why turnout in Upper East Side looks the way it does
Areas with high high-school completion turn out at higher rates. About 98% of adults in Upper East Side have completed high school, about 8 points above the U.S. average of 90%. Learn more about the findings and methodology on the political spectrum map.
Nearby Neighborhoods
- Downer Woods, Milwaukee, WI D+55
- Murray Hill, Milwaukee, WI D+64
- Riverwest, Milwaukee, WI D+70
- Northpoint, Milwaukee, WI D+57
- Lower East Side, Milwaukee, WI D+61
- Harambee, Milwaukee, WI D+82
- Yankee Hill, Milwaukee, WI D+57
- Juneau Town, Milwaukee, WI D+48
- Borchert Field, Milwaukee, WI D+88
- North Division, Milwaukee, WI D+86
Neighborhoods with Similar Populations
- Lewis and Clark, Missoula, MT D+47
- Villas at Norcross, Norcross, GA D+55
- Meredith Parkwood, Santa Ana, CA D+13
- Willow Park, Aurora, CO D+33
- Lincoln-Lemington-Belmar, Pittsburgh, PA D+83
- Crary-St Marys, Detroit, MI D+87
- Northeast Park, St. Petersburg, FL R+8
- Northlake Park at Lake Nona, Orlando, FL R+6
- The Gardens, Ocean City, NJ R+6
- Cleveland Heights, Lakeland, FL R+16
Sources and methodology
Precinct-level voting records used to fit the model come from Wisconsin Elections Commission, distributed by the Voting and Election Science Team. Demographic inputs come from the U.S. Census Bureau (ACS 5-year estimates and the 2020 Decennial Census). Health and environmental inputs come from the CDC (PLACES and the Environmental Justice Index). Land cover comes from the USGS and EPA. Election-day and lead-up weather come from PRISM 4km daily grids and the NOAA Global Historical Climatology Network. Mail-voting and election-administration patterns come from the MIT Election Lab's Survey of the Performance of American Elections. Block-group crime detail comes from CrimeGrade. Internet data and modeling support provided by ISPreports.org.
Modeling and analysis by the BestNeighborhood data science team. Full methodology and findings: political spectrum map.
Methodology reviewed by the BestNeighborhood data team. Last updated May 2026.