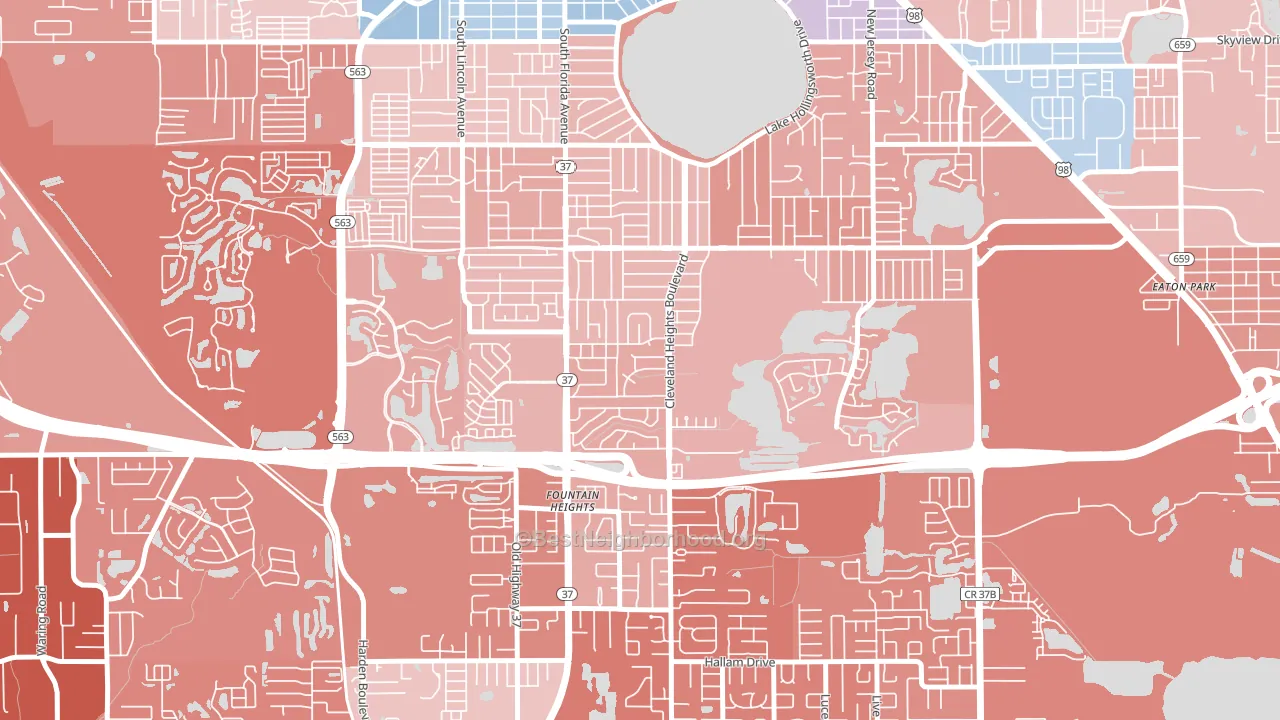
Cleveland Heights leans Republican by roughly 16 points: about 42% of voters vote Democratic and 58% Republican.
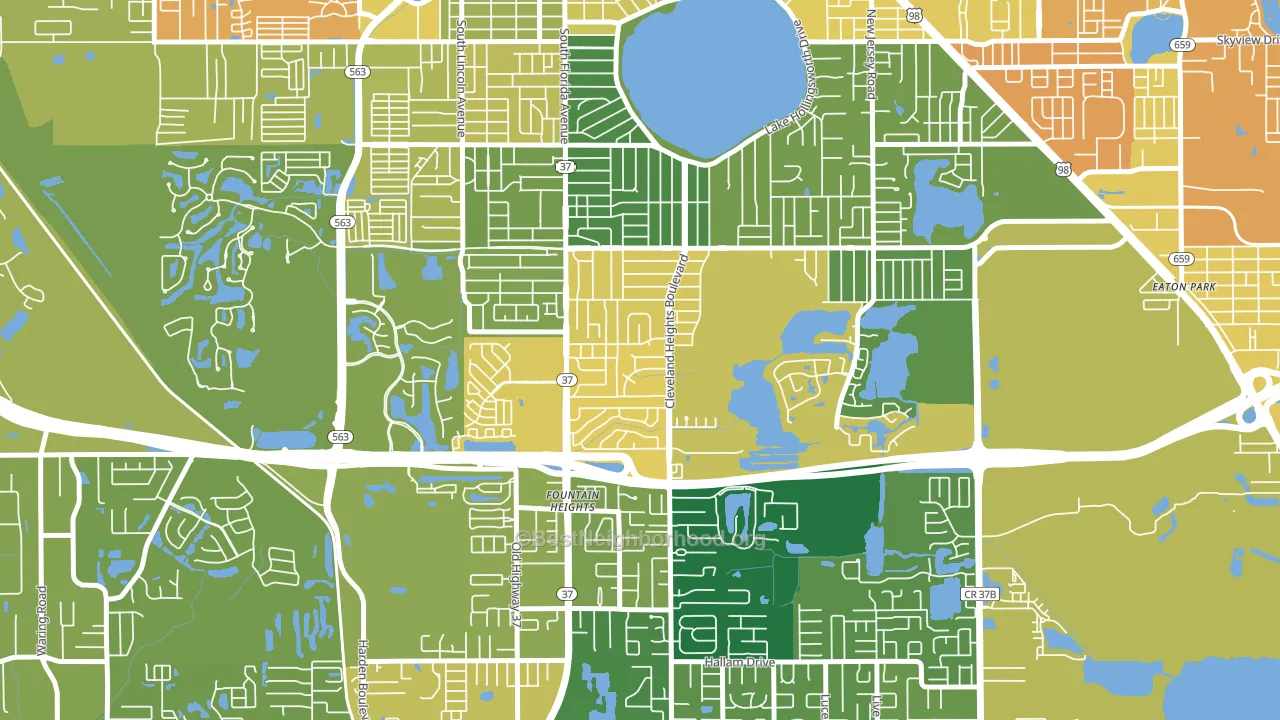
About 51% of adults in Cleveland Heights typically vote, below the U.S. average of about 62%. Among adults in Cleveland Heights, ~21% vote Democratic, ~29% Republican, and ~50% don't vote. The map below shows estimated turnout by block group.
How Cleveland Heights compares
Politically, Cleveland Heights sits close to the rest of Florida.
Why Cleveland Heights leans the way it does
Density, race composition, education, and family structure all sit close to their national averages in Cleveland Heights. The lean here lands roughly where demographic data alone would predict.
Homeownership and voter turnout
Places with renter-heavy households tend to turn out at a lower rate; Cleveland Heights, Lakeland, FL sits below the national average on this measure.
Why turnout in Cleveland Heights looks the way it does
Turnout in Cleveland Heights sits close to the national pattern. Routine healthcare access, homeownership, education, and food security all land near their national averages here. Learn more about the findings and methodology on the political spectrum map.
Nearby Neighborhoods
- Lake Hollingsworth, Lakeland, FL R+19
- Imperial Lakes, Fuller Heights, FL R+37
- Wahneta, Winter Haven, FL R+16
- Cory Lake Isles, Tampa, FL Even
- New Tampa, Tampa, FL D+14
- Meadow Point, Wesley Chapel, FL R+5
- Hunters Green, Tampa, FL D+9
- Orient Park, Tampa, FL D+9
- Lake Marion Village, Poinciana, FL D+25
- Tampa Palms, Tampa, FL D+16
Neighborhoods with Similar Populations
- Ol Sun, Clifton, CO R+30
- Northlake Park at Lake Nona, Orlando, FL R+6
- New Hampshire Gardens, Takoma Park, MD D+78
- Crary-St Marys, Detroit, MI D+87
- Lincoln-Lemington-Belmar, Pittsburgh, PA D+83
- Dudgeon-Monroe, Madison, WI D+87
- Lewis and Clark, Missoula, MT D+47
- Upper East Side, Milwaukee, WI D+58
- Villas at Norcross, Norcross, GA D+55
- Debaliviere Place, St. Louis, MO D+81
Sources and methodology
Precinct-level voting records used to fit the model come from Florida Division of Elections, distributed by the Voting and Election Science Team. Demographic inputs come from the U.S. Census Bureau (ACS 5-year estimates and the 2020 Decennial Census). Health and environmental inputs come from the CDC (PLACES and the Environmental Justice Index). Land cover comes from the USGS and EPA. Election-day and lead-up weather come from PRISM 4km daily grids and the NOAA Global Historical Climatology Network. Mail-voting and election-administration patterns come from the MIT Election Lab's Survey of the Performance of American Elections. Block-group crime detail comes from CrimeGrade. Internet data and modeling support provided by ISPreports.org.
Modeling and analysis by the BestNeighborhood data science team. Full methodology and findings: political spectrum map.
Methodology reviewed by the BestNeighborhood data team. Last updated May 2026.