Lewis and Clark leans heavily Democratic by roughly 48 points: about 74% of voters vote Democratic and 26% Republican.
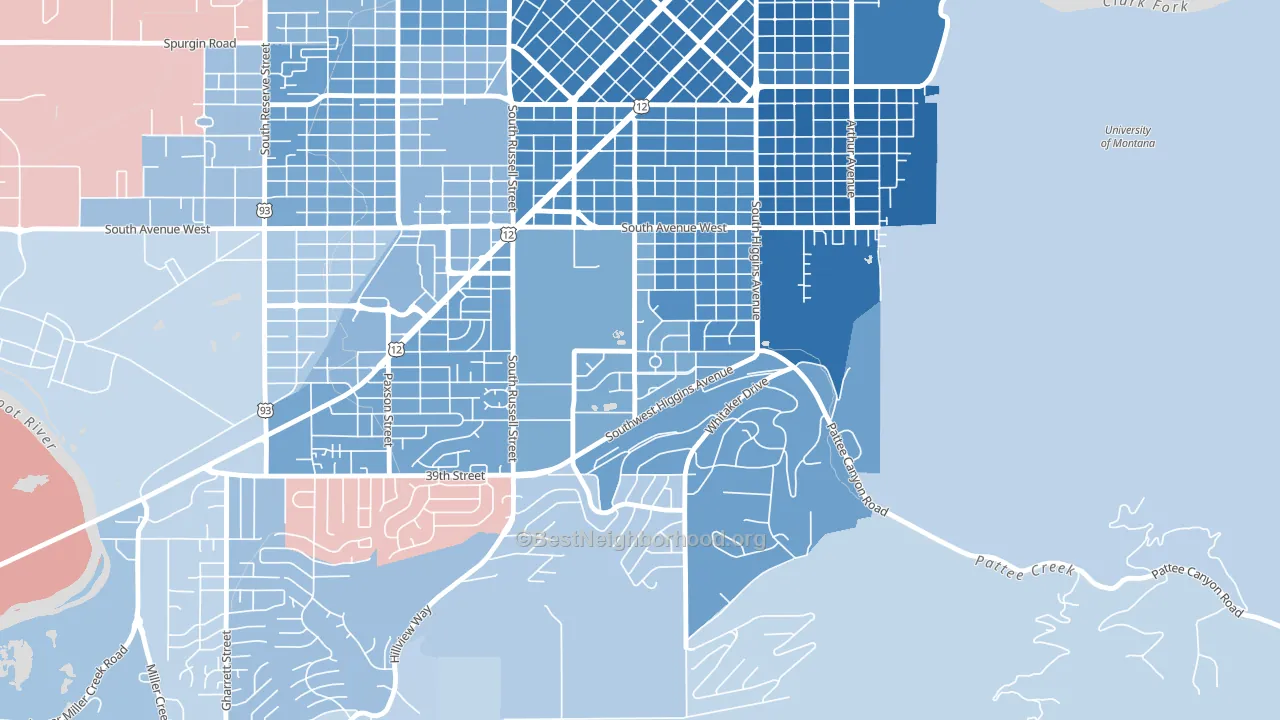
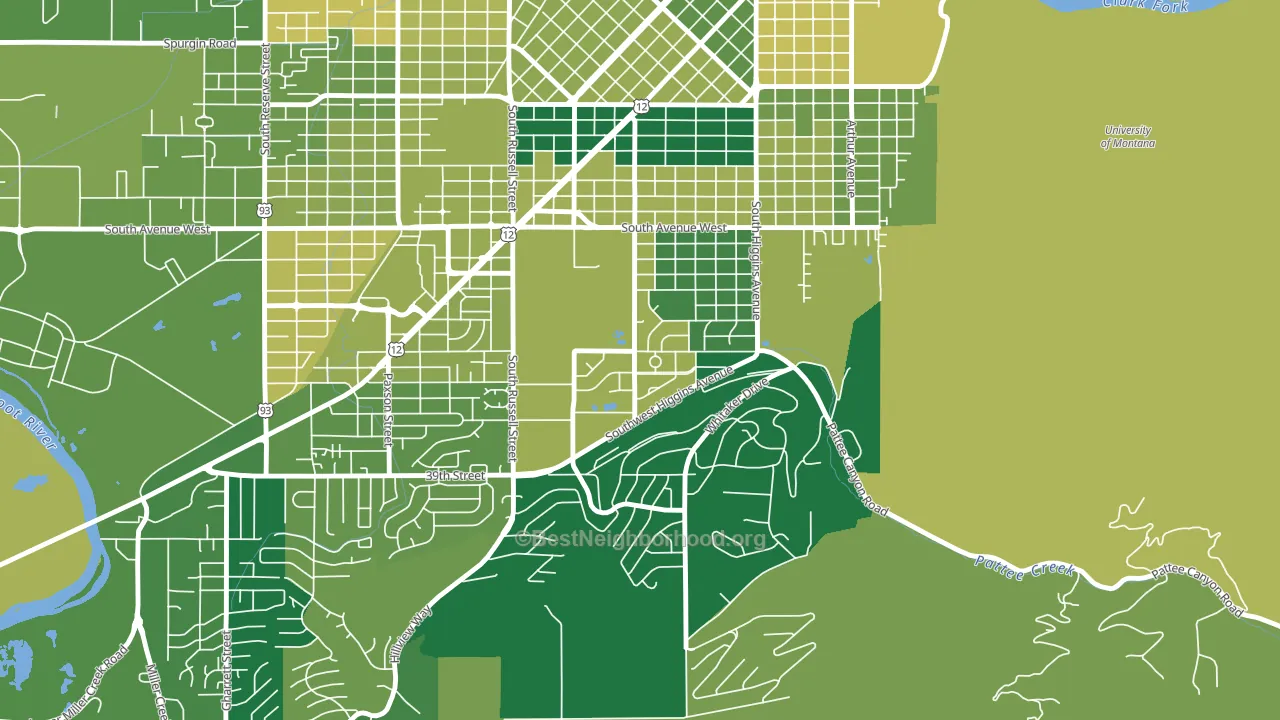
About 86% of adults in Lewis and Clark typically vote, above the U.S. average of about 62%. Among adults in Lewis and Clark, ~64% vote Democratic, ~22% Republican, and ~14% don't vote. The map below shows estimated turnout by block group.
How Lewis and Clark compares
Among neighborhoods within 5 miles, Lewis and Clark leans more Democratic than 10 of 13 neighbors.
Lewis and Clark runs about 67 points more Democratic than Montana as a whole. Montana leans Republican overall, while Lewis and Clark is one of the few Democratic-leaning pockets.
Politics vary noticeably by block within Lewis and Clark. The north side is the most Democratic-leaning (D+54) and the southeast side is the least Democratic-leaning (D+36), a spread of about 18 points.
Why Lewis and Clark leans the way it does
This analysis examined 14,881 data points per neighborhood to find what predicts political lean and turnout. The items below are a few correlations that stood out for Lewis and Clark, not a ranked or complete list of what matters most.
Lewis and Clark votes against the grain of Montana. Montana leans Republican overall, while Lewis and Clark runs about 67 points more Democratic. High college attainment predicts Democratic voting, and Lewis and Clark sits in the top quarter (about 57%, above 78% of neighborhoods).
High-school completion and voter turnout
Places with high-school-completion-heavy adults tend to turn out at a higher rate; Lewis and Clark, Missoula, MT sits in the top tenth nationally on this measure.
Why turnout in Lewis and Clark looks the way it does
Areas with high high-school completion turn out at higher rates. More than 99% of adults in Lewis and Clark have completed high school, about 6 points above the Montana average of 94%. Learn more about the findings and methodology on the political spectrum map.
Nearby Neighborhoods
- Southgate Triangle, Missoula, MT D+26
- Rose Park, Missoula, MT D+59
- University District, Missoula, MT D+59
- South 39th Street, Missoula, MT D+14
- Franklin To The Fort, Missoula, MT D+29
- Moose Can Gully, Missoula, MT D+23
- Heart of Missoula, Missoula, MT D+51
- Emma Dickinson Orchard Homes, Missoula, MT D+31
- Westside, Missoula, MT D+35
- Northside, Missoula, MT D+34
Neighborhoods with Similar Populations
- Upper East Side, Milwaukee, WI D+58
- Villas at Norcross, Norcross, GA D+55
- Meredith Parkwood, Santa Ana, CA D+13
- Willow Park, Aurora, CO D+33
- Crary-St Marys, Detroit, MI D+87
- Lincoln-Lemington-Belmar, Pittsburgh, PA D+83
- Northlake Park at Lake Nona, Orlando, FL R+6
- Northeast Park, St. Petersburg, FL R+8
- Cleveland Heights, Lakeland, FL R+16
- The Gardens, Ocean City, NJ R+6
Sources and methodology
Precinct-level voting records used to fit the model come from Montana Secretary of State, Elections, distributed by the Voting and Election Science Team. Demographic inputs come from the U.S. Census Bureau (ACS 5-year estimates and the 2020 Decennial Census). Health and environmental inputs come from the CDC (PLACES and the Environmental Justice Index). Land cover comes from the USGS and EPA. Election-day and lead-up weather come from PRISM 4km daily grids and the NOAA Global Historical Climatology Network. Mail-voting and election-administration patterns come from the MIT Election Lab's Survey of the Performance of American Elections. Block-group crime detail comes from CrimeGrade. Internet data and modeling support provided by ISPreports.org.
Modeling and analysis by the BestNeighborhood data science team. Full methodology and findings: political spectrum map.
Methodology reviewed by the BestNeighborhood data team. Last updated May 2026.