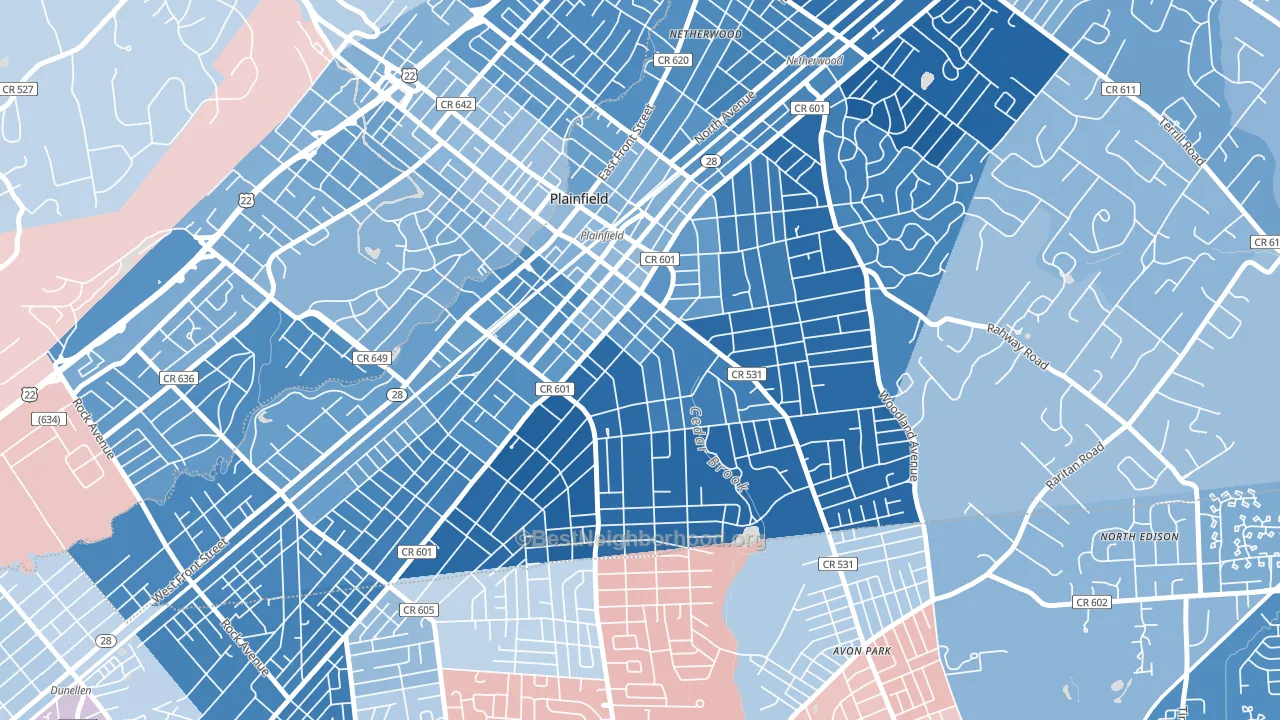
Van Wyck Brooks Historic District is a Democratic stronghold. About 79% of voters here vote Democratic and 21% Republican.
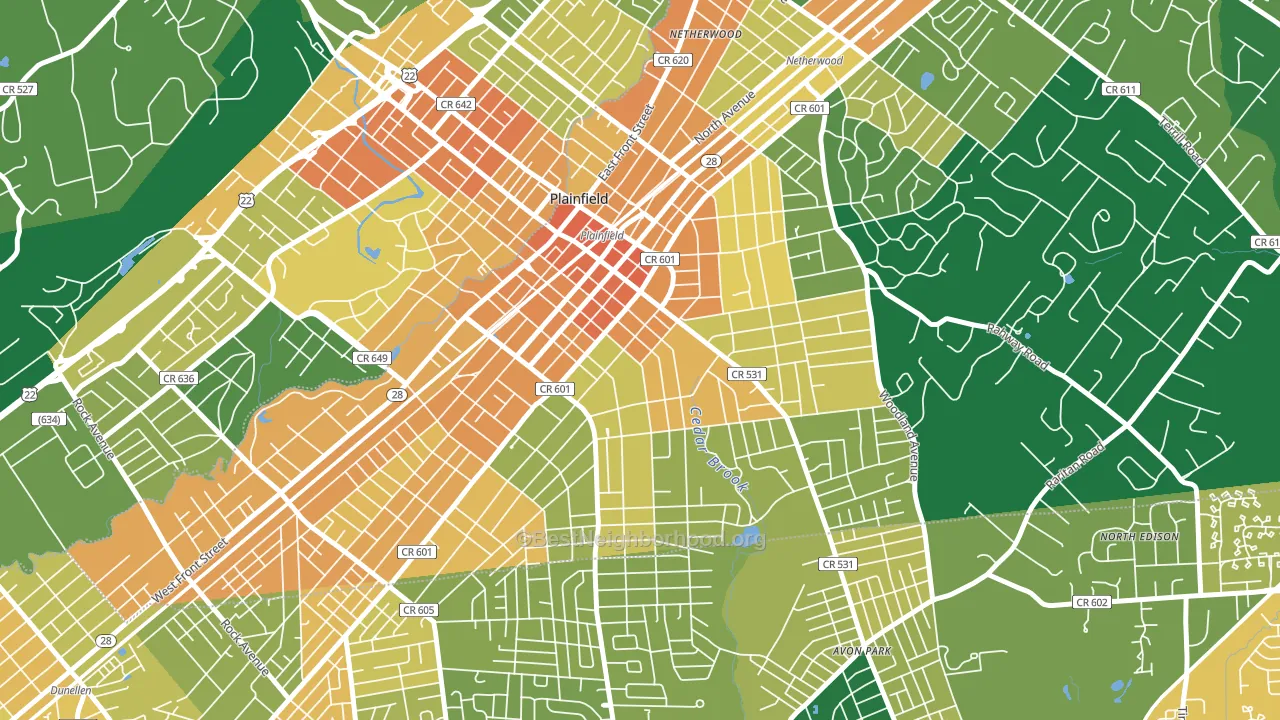
About 41% of adults in Van Wyck Brooks Historic District typically vote, below the U.S. average of about 62%. Among adults in Van Wyck Brooks Historic District, ~33% vote Democratic, ~9% Republican, and ~58% don't vote. The map below shows estimated turnout by block group.
How Van Wyck Brooks Historic District compares
Van Wyck Brooks Historic District sits in a sparsely populated area with few comparable neighborhoods nearby.
Van Wyck Brooks Historic District runs about 52 points more Democratic than New Jersey as a whole.
Politics vary noticeably by block within Van Wyck Brooks Historic District. The south side is the most Democratic-leaning (D+70) and the northeast side is the least Democratic-leaning (D+45), a spread of about 25 points.
Why Van Wyck Brooks Historic District leans the way it does
This analysis examined 14,881 data points per neighborhood to find what predicts political lean and turnout. The items below are a few correlations that stood out for Van Wyck Brooks Historic District, not a ranked or complete list of what matters most.
Dense areas vote Democratic. More than 99% of residents in Van Wyck Brooks Historic District live in densely developed areas, about 64 points above the U.S. average of 36%. A high never-married share predicts Democratic voting, and about 50% of adults in Van Wyck Brooks Historic District have never been married, above 82% of neighborhoods.
Population density and Democratic lean
Places with high population density tend to lean Democratic; Van Wyck Brooks Historic District, Plainfield, NJ sits in the top tenth nationally on this measure.
Why turnout in Van Wyck Brooks Historic District looks the way it does
Areas with limited routine healthcare access turn out at lower rates. Van Wyck Brooks Historic District is in the bottom quarter nationally for routine-care measures such as insurance coverage, preventive screenings, and dental visits. The uninsured rate here is about 22%, about 12 points above the New Jersey average of 10%. Renters vote less often than owners, and about 63% of households in Van Wyck Brooks Historic District rent, compared to around 44% in nearby neighborhoods. High food insecurity lines up with lower turnout, and about 32% of adults in Van Wyck Brooks Historic District report food insecurity, above 85% of neighborhoods. Learn more about the findings and methodology on the political spectrum map.
Nearby Neighborhoods
- Crescent Area Historic District, Plainfield, NJ D+43
- Washington Park Historic District, North Plainfield, NJ D+25
- Robinvale, Metuchen, NJ D+36
- Bonhamtown, Edison, NJ D+16
- Overlook, Summit, NJ D+27
- Bridgeton, Woodbridge, NJ D+4
- Townelake, Sayreville, NJ R+11
- Downtown Elizabeth, Elizabeth, NJ D+27
- Presidents Park, Parlin, NJ R+10
- Charleston, Staten Island, NY R+51
Neighborhoods with Similar Populations
- Ortega Farms, Jacksonville, FL D+11
- Highland Park, Grand Rapids, MI D+38
- East Columbus, Columbus, IN R+21
- Park Place, Mobile, AL D+5
- Indian Village, Lincoln, NE D+32
- Nob Hill, Albuquerque, NM D+72
- Center Street Historic District, Ashland, OH R+23
- Holiday Park, Palm Bay, FL R+9
- Oakwell Farms, San Antonio, TX D+18
- Carthage, Cincinnati, OH D+34
Sources and methodology
Precinct-level voting records used to fit the model come from New Jersey Division of Elections, distributed by the Voting and Election Science Team. Demographic inputs come from the U.S. Census Bureau (ACS 5-year estimates and the 2020 Decennial Census). Health and environmental inputs come from the CDC (PLACES and the Environmental Justice Index). Land cover comes from the USGS and EPA. Election-day and lead-up weather come from PRISM 4km daily grids and the NOAA Global Historical Climatology Network. Mail-voting and election-administration patterns come from the MIT Election Lab's Survey of the Performance of American Elections. Block-group crime detail comes from CrimeGrade. Internet data and modeling support provided by ISPreports.org.
Modeling and analysis by the BestNeighborhood data science team. Full methodology and findings: political spectrum map.
Methodology reviewed by the BestNeighborhood data team. Last updated May 2026.