Washington County leans heavily Republican by roughly 36 points: about 32% of voters vote Democratic and 68% Republican.
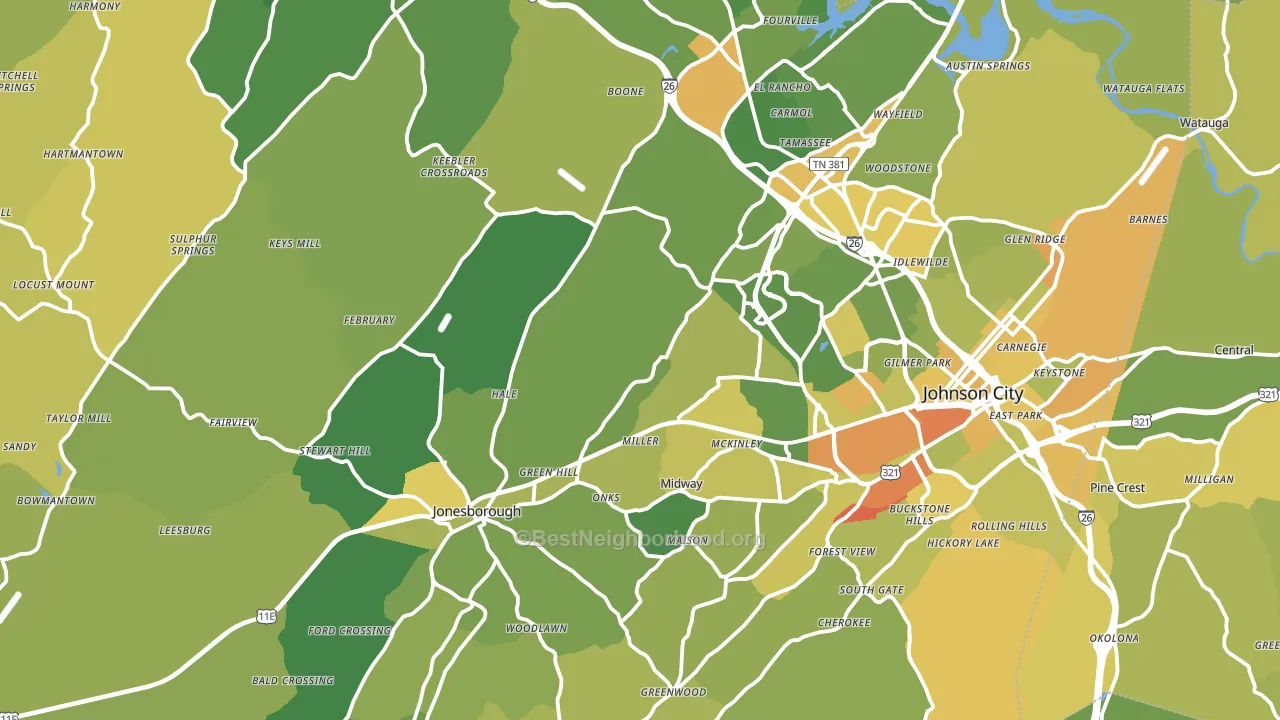
About 66% of adults in Washington County typically vote, near the U.S. average of about 62%. Among adults in Washington County, ~21% vote Democratic, ~45% Republican, and ~34% don't vote. The map below shows estimated turnout by block group.
How Washington County compares
Among counties within 50 miles, Washington County leans more Republican than 3 of 21 neighbors.
Washington County runs about 7 points more Republican than Tennessee as a whole.
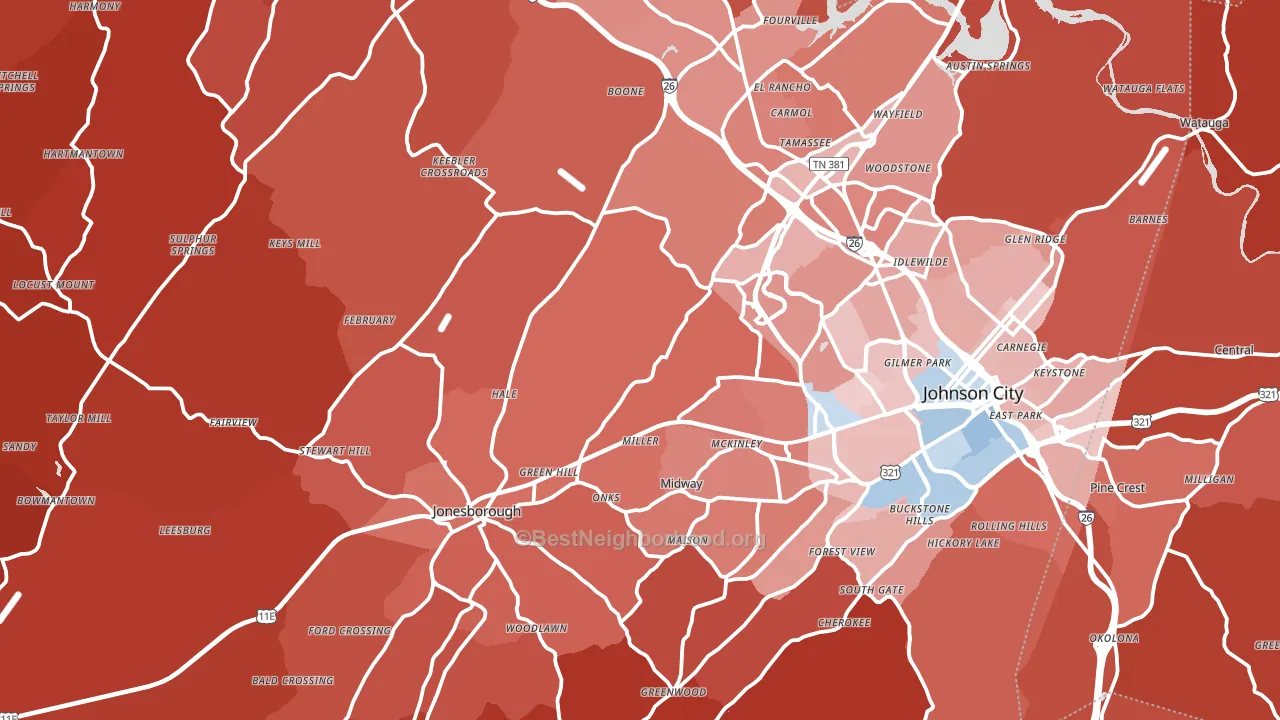
Politics vary noticeably by city within Washington County. The southwest side is the most Republican-leaning (R+62) and the east side is the least Republican-leaning (R+4), a spread of about 58 points.
Why Washington County leans the way it does
This analysis examined 14,881 data points per county to find what predicts political lean and turnout. The items below are a few correlations that stood out for Washington County, not a ranked or complete list of what matters most.
Washington County votes Republican even though it is densely developed (about 54%, far above the Tennessee average of 21%). State and regional patterns outweigh the Democratic lean that density usually predicts here.
Developed land and Democratic lean
Places with a heavily developed built environment tend to lean Democratic; Washington County, TN sits in the top quarter nationally on this measure. Developed land does not change how people vote; it mostly reflects how urban a place is.
Why turnout in Washington County looks the way it does
Turnout in Washington County sits close to the national pattern. Routine healthcare access, homeownership, education, and food security all land near their national averages here. Learn more about the findings and methodology on the political spectrum map.
Nearby Counties
- Unicoi County, TN R+57
- Carter County, TN R+61
- Sullivan County, TN R+50
- Greene County, TN R+62
- Bristol City, VA R+32
- Hawkins County, TN R+66
- Scott County, VA R+70
- Yancey County, NC R+43
- Mitchell County, NC R+56
- Avery County, NC R+52
Counties with Similar Populations
- Cache County, UT R+32
- Tangipahoa Parish, LA R+31
- Cambria County, PA R+35
- Harnett County, NC R+21
- Wood County, OH R+11
- Kendall County, IL Even
- Calhoun County, MI R+9
- Warren County, KY R+16
- Pickens County, SC R+43
- Tazewell County, IL R+29
Sources and methodology
Precinct-level voting records used to fit the model come from Tennessee Secretary of State, Division of Elections, distributed by the Voting and Election Science Team. Demographic inputs come from the U.S. Census Bureau (ACS 5-year estimates and the 2020 Decennial Census). Health and environmental inputs come from the CDC (PLACES and the Environmental Justice Index). Land cover comes from the USGS and EPA. Election-day and lead-up weather come from PRISM 4km daily grids and the NOAA Global Historical Climatology Network. Mail-voting and election-administration patterns come from the MIT Election Lab's Survey of the Performance of American Elections. Block-group crime detail comes from CrimeGrade. Internet data and modeling support provided by ISPreports.org.
Modeling and analysis by the BestNeighborhood data science team. Full methodology and findings: political spectrum map.
Methodology reviewed by the BestNeighborhood data team. Last updated May 2026.