Mitchell County is a Republican stronghold. About 22% of voters here vote Democratic and 78% Republican.
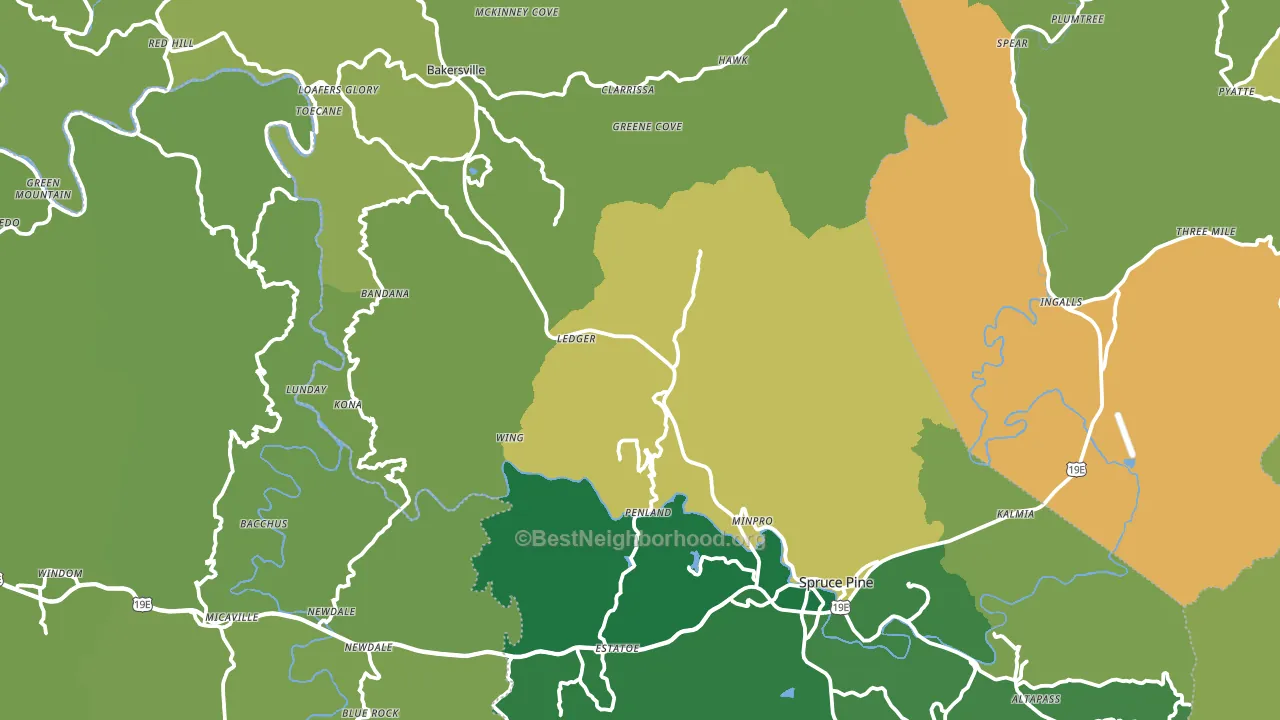
About 80% of adults in Mitchell County typically vote, above the U.S. average of about 62%. Among adults in Mitchell County, ~18% vote Democratic, ~62% Republican, and ~20% don't vote. The map below shows estimated turnout by block group.
How Mitchell County compares
Among counties within 50 miles, Mitchell County leans more Republican than 15 of 19 neighbors.
Mitchell County runs about 53 points more Republican than North Carolina as a whole.
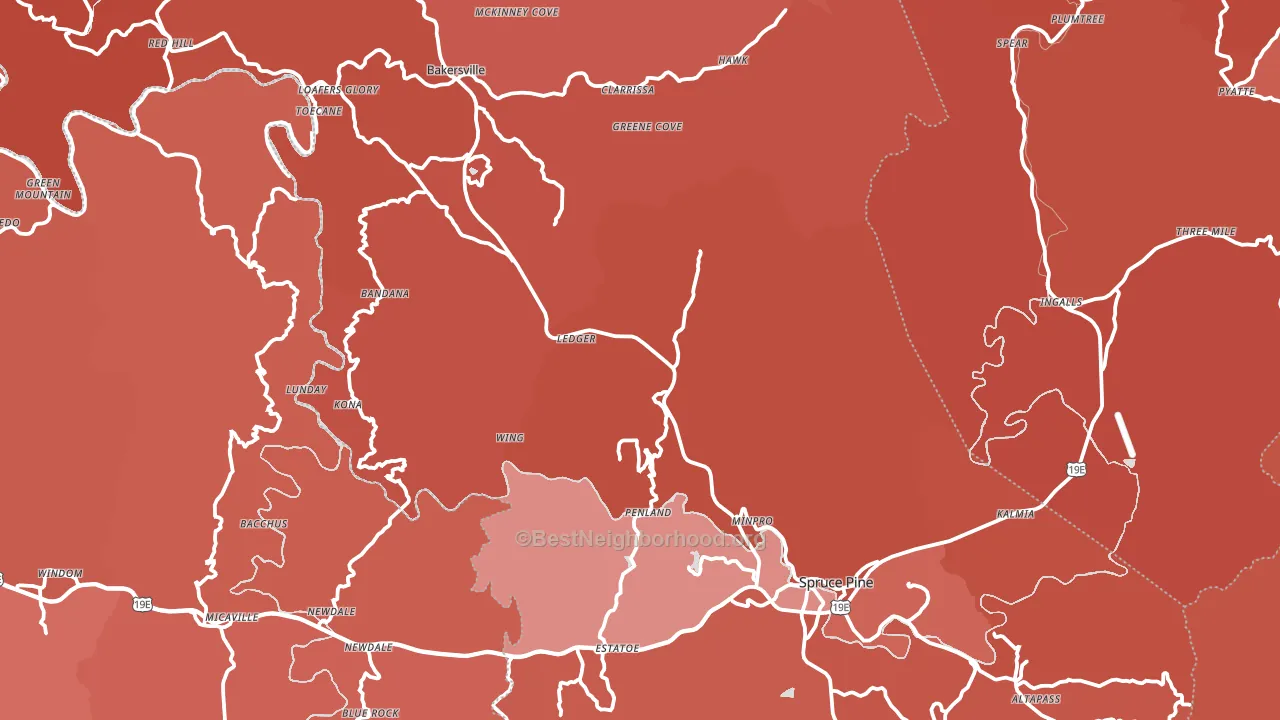
Politics vary noticeably by city within Mitchell County. The northwest side is the most Republican-leaning (R+66) and the south side is the least Republican-leaning (R+52), a spread of about 15 points.
Why Mitchell County leans the way it does
This analysis examined 14,881 data points per county to find what predicts political lean and turnout. The items below are a few correlations that stood out for Mitchell County, not a ranked or complete list of what matters most.
Rural areas vote Republican. About 12% of residents in Mitchell County live in densely developed areas, about 14 points below the North Carolina average of 27%.
Paved land cover and Republican lean
Places with little paved surface tend to lean Republican; Mitchell County, NC sits in the bottom quarter nationally on this measure. Paved ground does not change how people vote; it mostly reflects how urban and built-up a place is.
Why turnout in Mitchell County looks the way it does
Areas with strong routine healthcare access turn out at higher rates. Mitchell County is in the top quarter nationally for routine-care measures such as insurance coverage, preventive screenings, and dental visits. The dental-visit rate here is about 64%, above 74% of counties. Learn more about the findings and methodology on the political spectrum map.
Nearby Counties
- Yancey County, NC R+43
- Avery County, NC R+52
- Unicoi County, TN R+57
- McDowell County, NC R+50
- Carter County, TN R+61
- Watauga County, NC D+6
- Madison County, NC R+34
- Burke County, NC R+40
- Washington County, TN R+37
- Caldwell County, NC R+47
Counties with Similar Populations
- Bledsoe County, TN R+66
- Larue County, KY R+58
- Clay County, SD D+2
- Sibley County, MN R+48
- Kossuth County, IA R+45
- Oglethorpe County, GA R+52
- Jackson County, TX R+62
- Arenac County, MI R+40
- Gasconade County, MO R+58
- LaSalle Parish, LA R+71
Sources and methodology
Precinct-level voting records used to fit the model come from North Carolina State Board of Elections, distributed by the Voting and Election Science Team. Demographic inputs come from the U.S. Census Bureau (ACS 5-year estimates and the 2020 Decennial Census). Health and environmental inputs come from the CDC (PLACES and the Environmental Justice Index). Land cover comes from the USGS and EPA. Election-day and lead-up weather come from PRISM 4km daily grids and the NOAA Global Historical Climatology Network. Mail-voting and election-administration patterns come from the MIT Election Lab's Survey of the Performance of American Elections. Block-group crime detail comes from CrimeGrade. Internet data and modeling support provided by ISPreports.org.
Modeling and analysis by the BestNeighborhood data science team. Full methodology and findings: political spectrum map.
Methodology reviewed by the BestNeighborhood data team. Last updated May 2026.