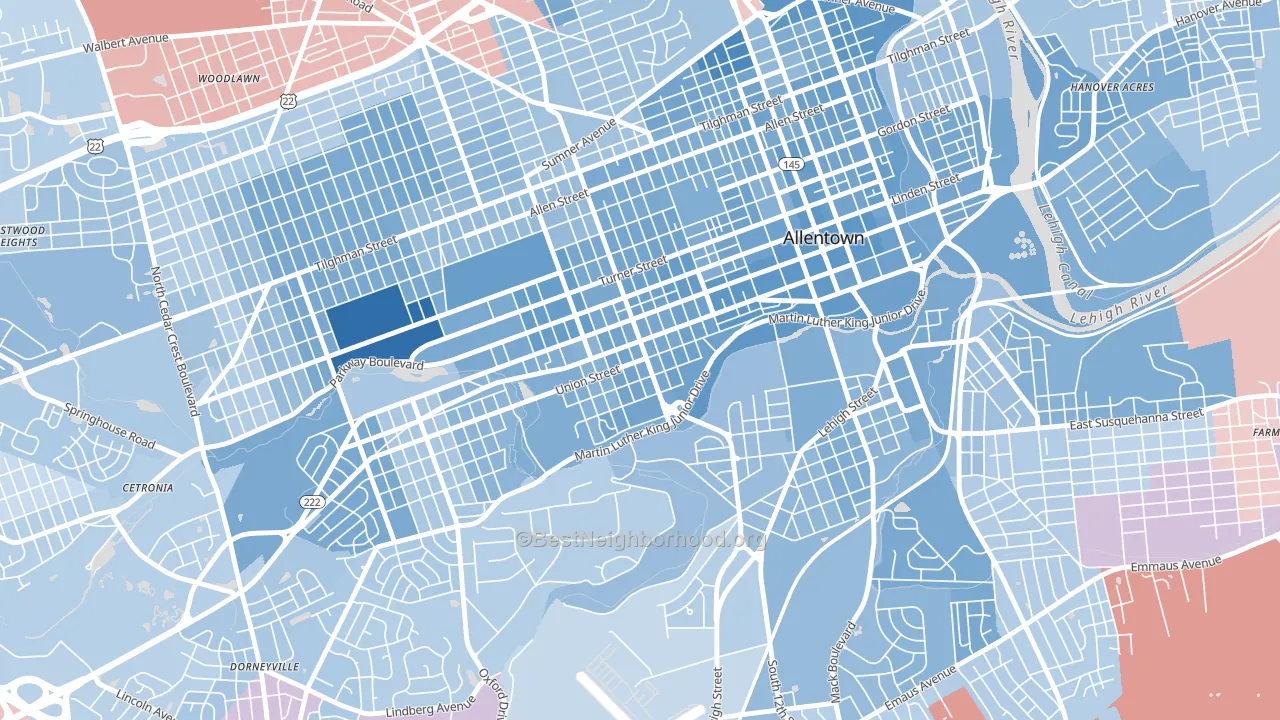
West Walnut leans heavily Democratic by roughly 30 points: about 65% of voters vote Democratic and 35% Republican.
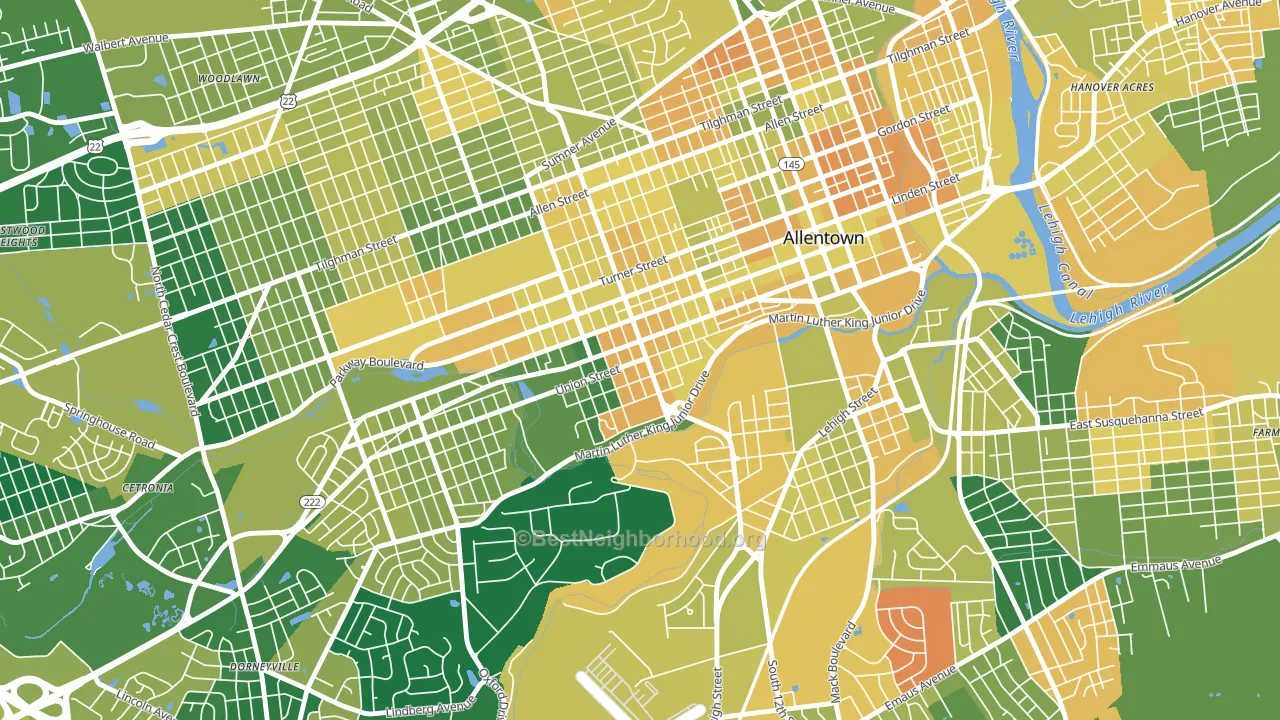
About 52% of adults in West Walnut typically vote, below the U.S. average of about 62%. Among adults in West Walnut, ~34% vote Democratic, ~18% Republican, and ~48% don't vote. The map below shows estimated turnout by block group.
How West Walnut compares
Among neighborhoods within 5 miles, West Walnut leans more Democratic than 12 of 15 neighbors.
West Walnut runs about 32 points more Democratic than Pennsylvania as a whole. Pennsylvania is roughly evenly split, and West Walnut sits clearly on the Democratic side.
Politics vary noticeably by block within West Walnut. The northwest side is the most Democratic-leaning (D+35) and the southwest side is the least Democratic-leaning (D+24), a spread of about 11 points.
Why West Walnut leans the way it does
This analysis examined 14,881 data points per neighborhood to find what predicts political lean and turnout. The items below are a few correlations that stood out for West Walnut, not a ranked or complete list of what matters most.
West Walnut votes against the grain of Pennsylvania. Pennsylvania is roughly evenly split, while West Walnut runs about 32 points more Democratic. A high never-married share predicts Democratic voting, and about 50% of adults in West Walnut have never been married, above 81% of neighborhoods.
Population density and Democratic lean
Places with high population density tend to lean Democratic; West Walnut, Allentown, PA sits in the top tenth nationally on this measure.
Why turnout in West Walnut looks the way it does
High-crime urban areas turn out at lower rates, mostly because the housing stress common in those areas makes voting harder. West Walnut sits in the top 15% nationally on a violent-crime measure. See CrimeGrade for more details. Low high-school completion lines up with lower turnout, and about 85% of adults in West Walnut have completed high school, below 76% of neighborhoods. Learn more about the findings and methodology on the political spectrum map.
Nearby Neighborhoods
- West Park, Allentown, PA D+29
- Old Allentown, Allentown, PA D+34
- Downtown, Allentown, PA D+38
- Fairview, Allentown, PA D+23
- Eighth Ward, Allentown, PA D+26
- West End Theatre District, Allentown, PA D+26
- Jordan Heights, Allentown, PA D+36
- NoTi, Allentown, PA D+30
- 1st Ward, Allentown, PA D+30
- salisbury, Allentown, PA R+2
Neighborhoods with Similar Populations
- Windom, Minneapolis, MN D+66
- Cripple Creek, Lincoln, NE D+4
- Westgate Vecinos, Albuquerque, NM D+19
- Mcbean, Hephzibah, GA R+25
- Houston Farms, Houston, TX Even
- Civano, Tucson, AZ Even
- Forest Hills, Jamaica Plain, MA D+68
- Green Island, Worcester, MA D+33
- Italian Village, Columbus, OH D+53
- Garment District, Manhattan, NY D+63
Sources and methodology
Precinct-level voting records used to fit the model come from Pennsylvania Department of State, Bureau of Elections, distributed by the Voting and Election Science Team. Demographic inputs come from the U.S. Census Bureau (ACS 5-year estimates and the 2020 Decennial Census). Health and environmental inputs come from the CDC (PLACES and the Environmental Justice Index). Land cover comes from the USGS and EPA. Election-day and lead-up weather come from PRISM 4km daily grids and the NOAA Global Historical Climatology Network. Mail-voting and election-administration patterns come from the MIT Election Lab's Survey of the Performance of American Elections. Block-group crime detail comes from CrimeGrade. Internet data and modeling support provided by ISPreports.org.
Modeling and analysis by the BestNeighborhood data science team. Full methodology and findings: political spectrum map.
Methodology reviewed by the BestNeighborhood data team. Last updated May 2026.