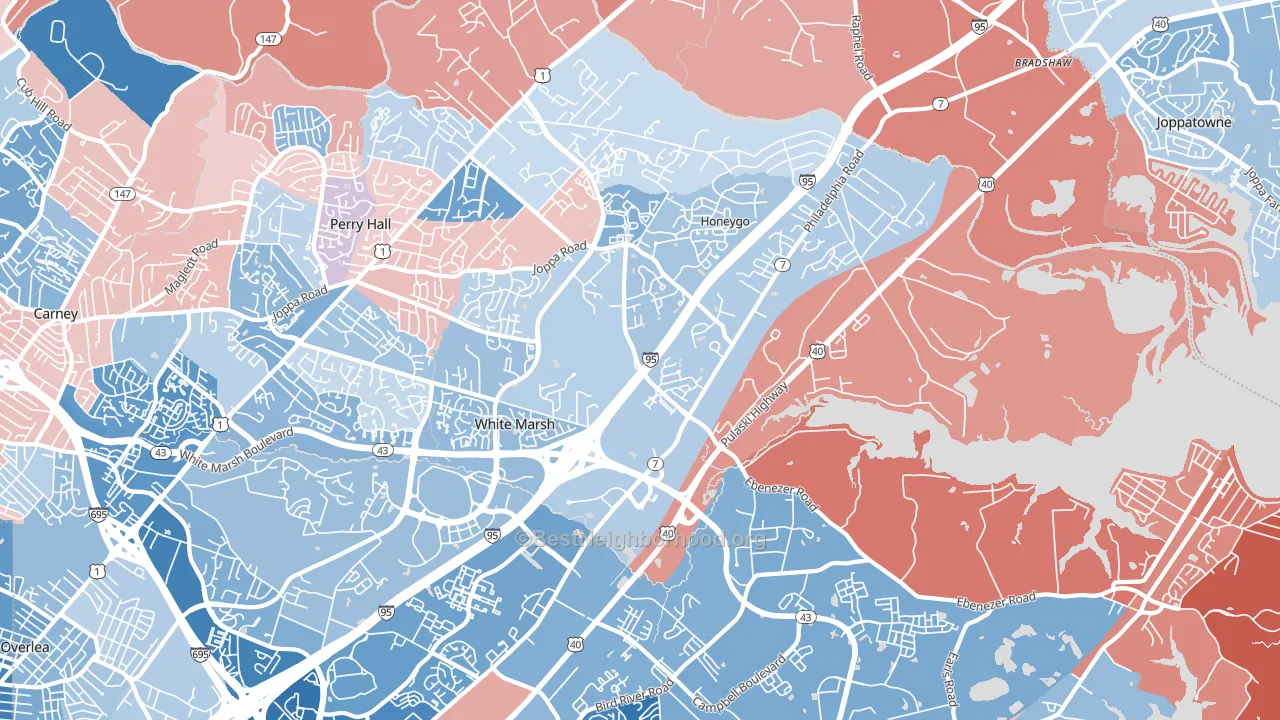
White Marsh leans slightly Democratic by roughly 8 points: about 54% of voters vote Democratic and 46% Republican.
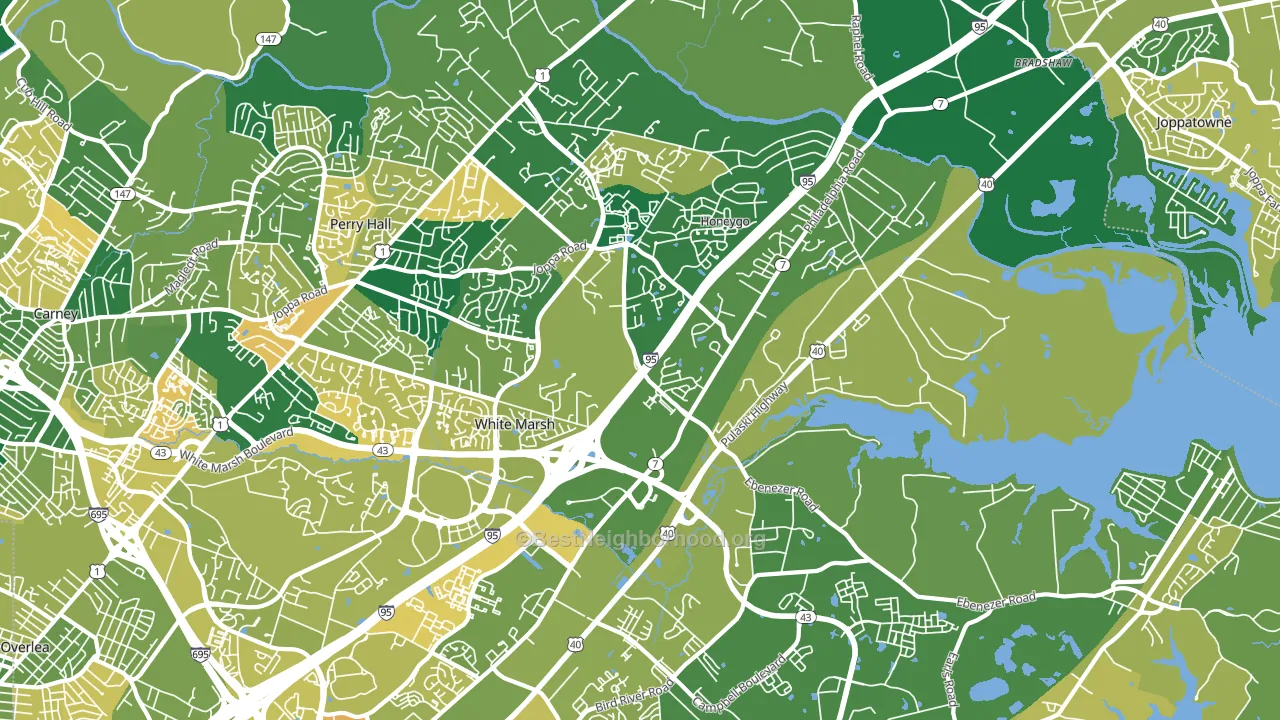
About 80% of adults in White Marsh typically vote, above the U.S. average of about 62%. Among adults in White Marsh, ~43% vote Democratic, ~37% Republican, and ~20% don't vote. The map below shows estimated turnout by block group.
How White Marsh compares
Among cities within 25 miles, White Marsh leans more Democratic than 64 of 120 neighbors.
White Marsh runs about 21 points more Republican than Maryland as a whole.
Politics vary noticeably by neighborhood within White Marsh. The southwest side runs the most Democratic (D+18) and the southeast side runs the most Republican (R+30), a spread of about 48 points.
Why White Marsh leans the way it does
This analysis examined 14,881 data points per city to find what predicts political lean and turnout. The items below are a few correlations that stood out for White Marsh, not a ranked or complete list of what matters most.
Areas with high college attainment vote Democratic. About 51% of adults in White Marsh hold a bachelor's degree, about 23 points above the U.S. average of 28%. Dense areas vote Democratic, and White Marsh sits in the top fifth on density (about 75%, above 93% of cities). A high never-married share predicts Democratic voting, and about 32% of adults in White Marsh have never been married, above 79% of cities.
Walkability and Democratic lean
Places with a highly walkable street grid tend to lean Democratic; White Marsh, MD sits in the top quarter nationally on this measure. A walkable street grid does not change how people vote; it mostly reflects how urban a place is.
Why turnout in White Marsh looks the way it does
Areas with high high-school completion turn out at higher rates. About 96% of adults in White Marsh have completed high school, about 6 points above the U.S. average of 90%. Learn more about the findings and methodology on the political spectrum map.
Nearby Cities
- Perry Hall, MD D+6
- Nottingham, MD D+30
- Middle River, MD D+14
- Rossville, MD D+45
- Upper Falls, MD R+39
- Kingsville, MD R+32
- Carney, MD D+14
- Overlea, MD D+24
- Joppatowne, MD D+5
Cities with Similar Populations
- Kodak, TN R+63
- Supply, NC R+43
- Gloucester Point, VA R+33
- Elwood, IN R+43
- Linthicum, MD D+3
- Lake Arbor, MD D+87
- Airway Heights, WA R+16
- Rising Sun, MD R+48
- McGregor, TX R+41
- Ephrata, WA R+44
Sources and methodology
Precinct-level voting records used to fit the model come from Maryland State Board of Elections, distributed by the Voting and Election Science Team. Demographic inputs come from the U.S. Census Bureau (ACS 5-year estimates and the 2020 Decennial Census). Health and environmental inputs come from the CDC (PLACES and the Environmental Justice Index). Land cover comes from the USGS and EPA. Election-day and lead-up weather come from PRISM 4km daily grids and the NOAA Global Historical Climatology Network. Mail-voting and election-administration patterns come from the MIT Election Lab's Survey of the Performance of American Elections. Block-group crime detail comes from CrimeGrade. Internet data and modeling support provided by ISPreports.org.
Modeling and analysis by the BestNeighborhood data science team. Full methodology and findings: political spectrum map.
Methodology reviewed by the BestNeighborhood data team. Last updated May 2026.