Wickerham Manor-Fisher leans Republican by roughly 28 points: about 36% of voters vote Democratic and 64% Republican.
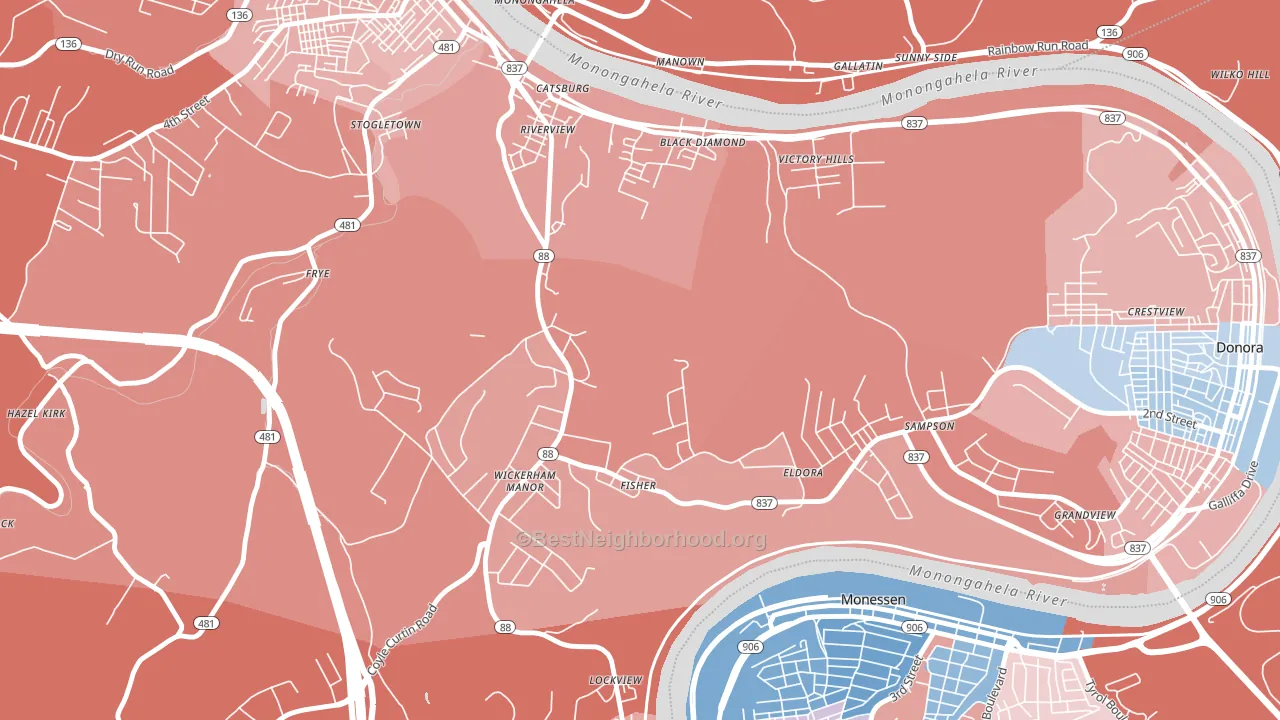
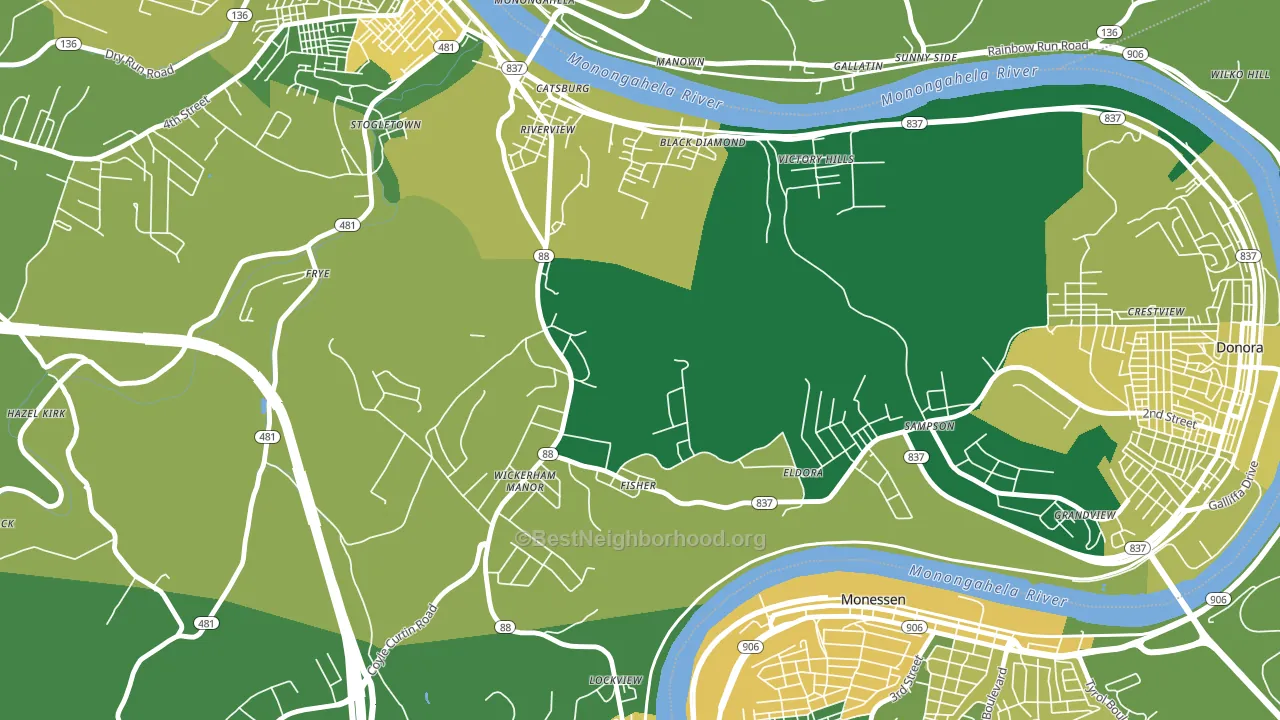
About more than 99% of adults in Wickerham Manor-Fisher typically vote, above the U.S. average of about 62%. Among adults in Wickerham Manor-Fisher, ~43% vote Democratic, ~75% Republican, and ~-18% don't vote. The map below shows estimated turnout by block group.
How Wickerham Manor-Fisher compares
Among cities within 25 miles, Wickerham Manor-Fisher leans more Republican than 117 of 264 neighbors.
Wickerham Manor-Fisher runs about 25 points more Republican than Pennsylvania as a whole.
Why Wickerham Manor-Fisher leans the way it does
This analysis examined 14,881 data points per city to find what predicts political lean and turnout. The items below are a few correlations that stood out for Wickerham Manor-Fisher, not a ranked or complete list of what matters most.
Wickerham Manor-Fisher votes Republican even though it is densely developed (about 24%, modestly below the Pennsylvania average of 33%). Here an older population outweighs the Democratic lean that density usually predicts.
Homeownership and voter turnout
Places with homeowner-heavy households tend to turn out at a higher rate; Wickerham Manor-Fisher, PA sits in the top tenth nationally on this measure.
Why turnout in Wickerham Manor-Fisher looks the way it does
Homeowners vote more often than renters. More than 99% of households in Wickerham Manor-Fisher own their home, about 21 points above the Pennsylvania average of 79%. High high-school completion lines up with higher turnout, and about 96% of adults in Wickerham Manor-Fisher have completed high school, above 85% of cities. Learn more about the findings and methodology on the political spectrum map.
Nearby Cities
- Monongahela, PA R+26
- North Charleroi, PA R+16
- Monessen, PA D+4
- Donora, PA R+7
- Charleroi, PA R+21
- New Eagle, PA R+30
- Webster, PA R+40
- Pricedale, PA R+27
- Van Voorhis, PA R+42
- North Belle Vernon, PA R+20
Cities with Similar Populations
- Lake City, CA R+37
- Dover, IL R+45
- Upton, UT R+58
- New Harrison, OH R+65
- Smiths Creek, KY R+68
- Samburg, TN R+73
- Trevlac, IN R+42
- Luray, SC D+17
- Garrison, NE R+65
- New Geneva, PA R+55
Sources and methodology
Precinct-level voting records used to fit the model come from Pennsylvania Department of State, Bureau of Elections, distributed by the Voting and Election Science Team. Demographic inputs come from the U.S. Census Bureau (ACS 5-year estimates and the 2020 Decennial Census). Health and environmental inputs come from the CDC (PLACES and the Environmental Justice Index). Land cover comes from the USGS and EPA. Election-day and lead-up weather come from PRISM 4km daily grids and the NOAA Global Historical Climatology Network. Mail-voting and election-administration patterns come from the MIT Election Lab's Survey of the Performance of American Elections. Block-group crime detail comes from CrimeGrade. Internet data and modeling support provided by ISPreports.org.
Modeling and analysis by the BestNeighborhood data science team. Full methodology and findings: political spectrum map.
Methodology reviewed by the BestNeighborhood data team. Last updated May 2026.