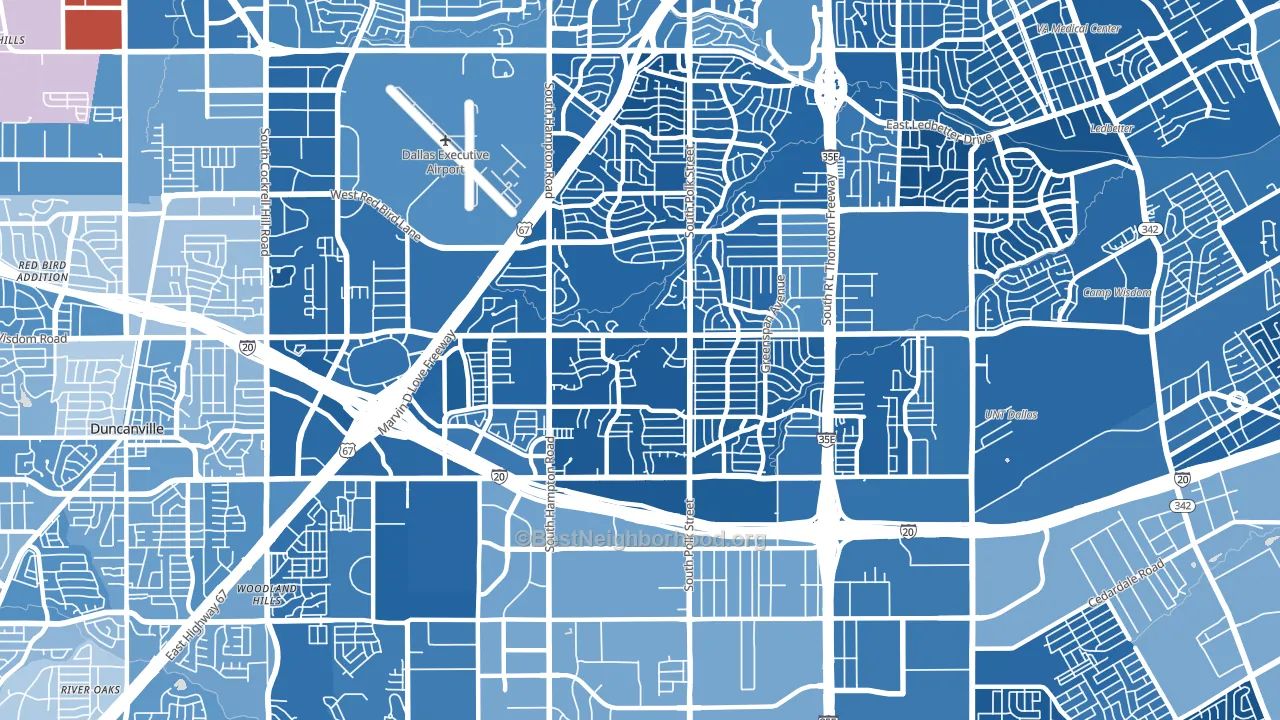
Wolf Creek is a Democratic stronghold. About 86% of voters here vote Democratic and 14% Republican.
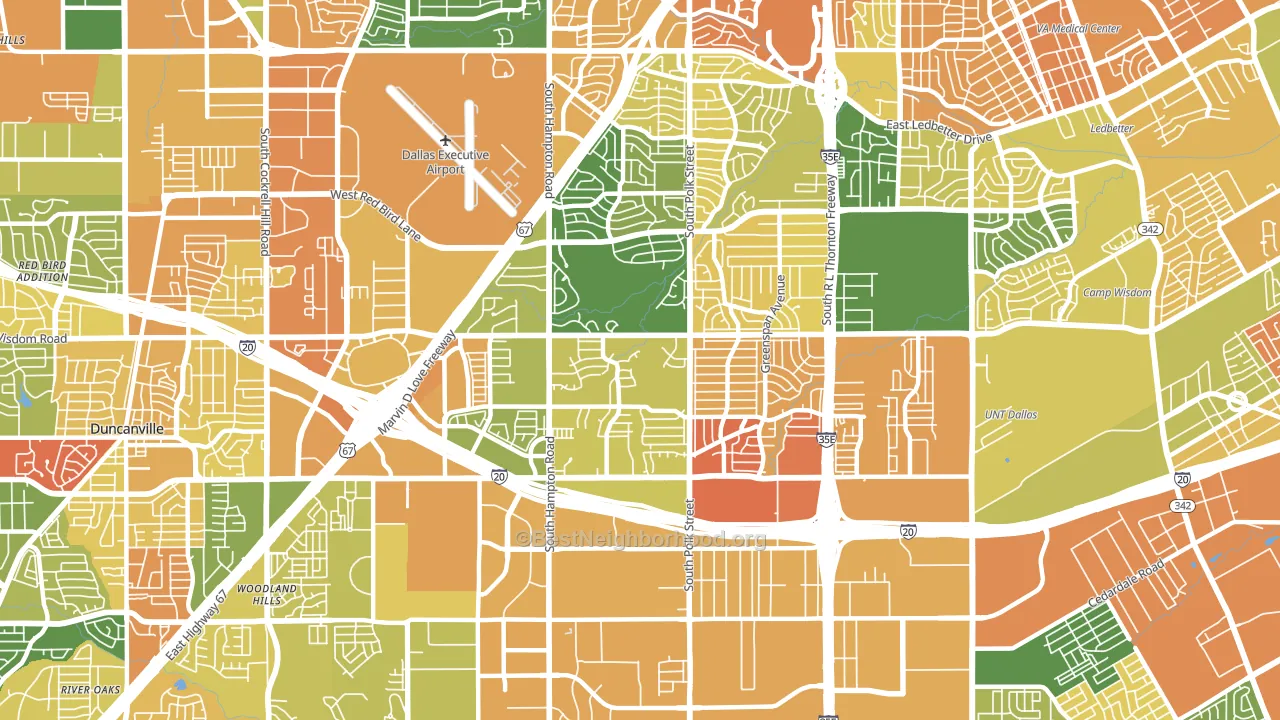
About 46% of adults in Wolf Creek typically vote, below the U.S. average of about 62%. Among adults in Wolf Creek, ~40% vote Democratic, ~6% Republican, and ~54% don't vote. The map below shows estimated turnout by block group.
How Wolf Creek compares
Among neighborhoods within 5 miles, Wolf Creek leans more Democratic than 3 of 4 neighbors.
Wolf Creek runs about 85 points more Democratic than Texas as a whole. Texas leans Republican overall, while Wolf Creek is one of the few Democratic-leaning pockets.
Politics vary noticeably by block within Wolf Creek. The northwest side is the most Democratic-leaning (D+82) and the southeast side is the least Democratic-leaning (D+51), a spread of about 30 points.
Why Wolf Creek leans the way it does
This analysis examined 14,881 data points per neighborhood to find what predicts political lean and turnout. The items below are a few correlations that stood out for Wolf Creek, not a ranked or complete list of what matters most.
Wolf Creek votes against the grain of Texas. Texas leans Republican overall, while Wolf Creek runs about 85 points more Democratic.
High-school completion, uninsured rate, and voter turnout
Places that combine low high-school-completion share and a high uninsured rate tend to turn out at a lower rate, as Wolf Creek, Dallas, TX does.
Why turnout in Wolf Creek looks the way it does
Areas with limited routine healthcare access turn out at lower rates. Wolf Creek is in the bottom quarter nationally for routine-care measures such as insurance coverage, preventive screenings, and dental visits. The dental-visit rate here is about 45%, about 8 points below the Texas average of 54%. Low high-school completion lines up with lower turnout, and about 79% of adults in Wolf Creek have completed high school, below 87% of neighborhoods. Learn more about the findings and methodology on the political spectrum map.
Nearby Neighborhoods
- Five Mile Creek, Dallas, TX D+54
- South Dallas Fair Park, Dallas, TX D+76
- Southwest Dallas, Dallas, TX D+45
- Cedar Crest, Dallas, TX D+68
- Winnetka Heights, Dallas, TX D+36
- Oak Cliff, Dallas, TX D+38
- South Boulevard Park Row, Dallas, TX D+68
- Eagle Ford, Dallas, TX D+47
- West End Historic District, Dallas, TX D+33
- Farmers Market District, Dallas, TX D+51
Neighborhoods with Similar Populations
- River Oaks, Houston, TX D+11
- Ocean Hill, Brooklyn, NY D+79
- Kings Bridge, Bronx, NY D+31
- North San Jose, San Jose, CA D+41
- West Flagler, Miami, FL R+33
- Southeast Boise, Boise, ID D+17
- Edenvale-Seven Trees, San Jose, CA D+28
- Southside, Lansing, MI D+38
- Hollywood Hills, Los Angeles, CA D+57
- Riverview West, Santa Ana, CA D+5
Sources and methodology
Precinct-level voting records used to fit the model come from Texas Secretary of State, Elections Division, distributed by the Voting and Election Science Team. Demographic inputs come from the U.S. Census Bureau (ACS 5-year estimates and the 2020 Decennial Census). Health and environmental inputs come from the CDC (PLACES and the Environmental Justice Index). Land cover comes from the USGS and EPA. Election-day and lead-up weather come from PRISM 4km daily grids and the NOAA Global Historical Climatology Network. Mail-voting and election-administration patterns come from the MIT Election Lab's Survey of the Performance of American Elections. Block-group crime detail comes from CrimeGrade. Internet data and modeling support provided by ISPreports.org.
Modeling and analysis by the BestNeighborhood data science team. Full methodology and findings: political spectrum map.
Methodology reviewed by the BestNeighborhood data team. Last updated May 2026.