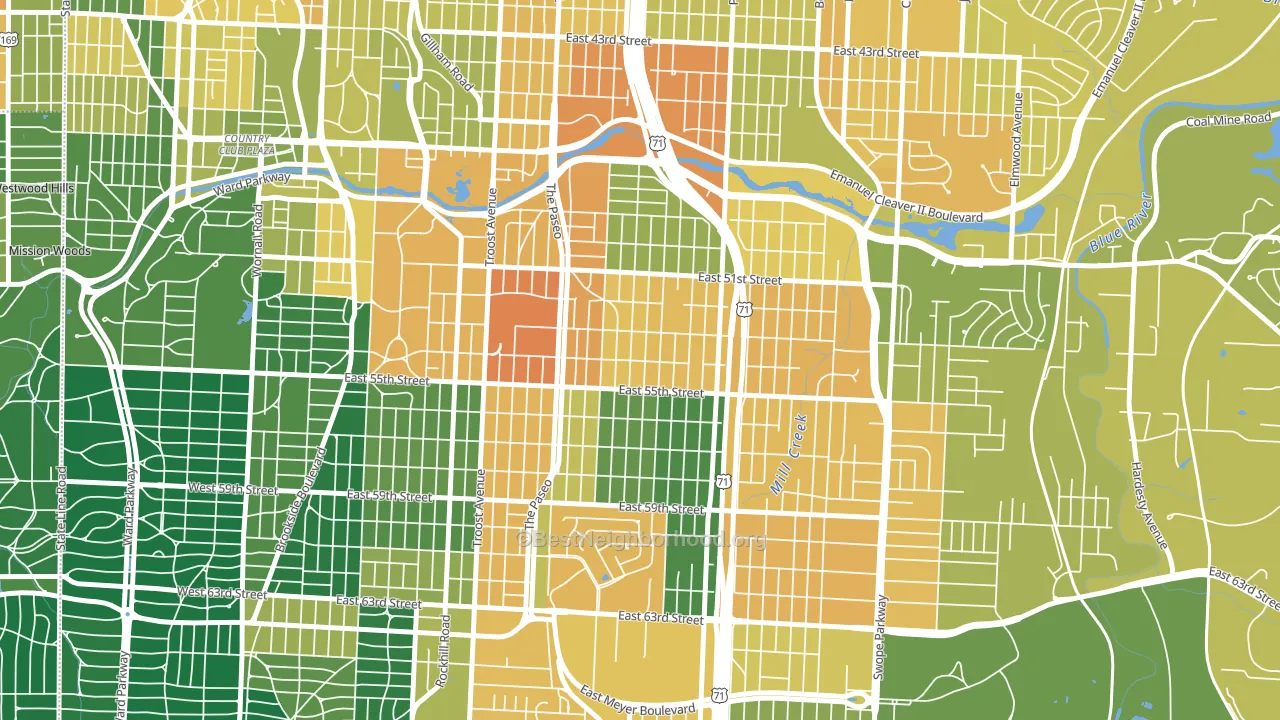
Blue Hills is a Democratic stronghold. About 92% of voters here vote Democratic and 8% Republican.
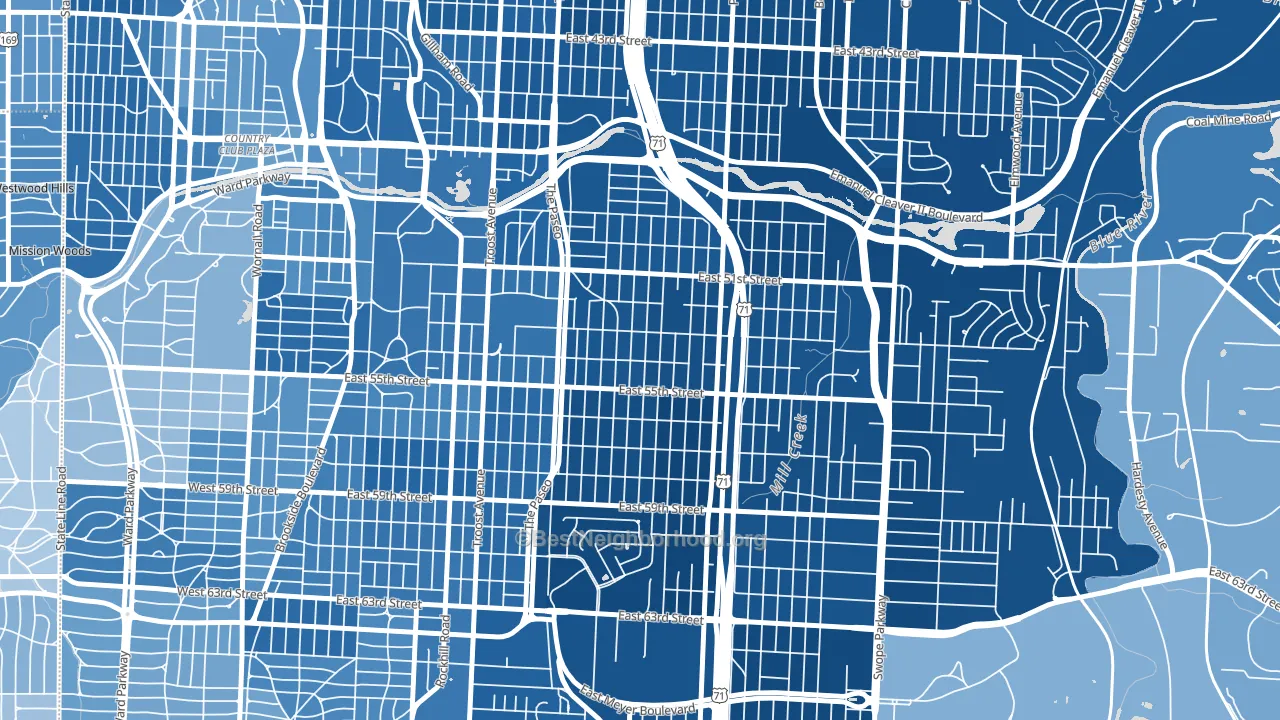
About 63% of adults in Blue Hills typically vote, near the U.S. average of about 62%. Among adults in Blue Hills, ~58% vote Democratic, ~5% Republican, and ~37% don't vote. The map below shows estimated turnout by block group.
How Blue Hills compares
Among neighborhoods within 5 miles, Blue Hills leans more Democratic than 17 of 18 neighbors.
Blue Hills runs about 101 points more Democratic than Missouri as a whole. Missouri leans Republican overall, while Blue Hills is one of the few Democratic-leaning pockets.
Why Blue Hills leans the way it does
This analysis examined 14,881 data points per neighborhood to find what predicts political lean and turnout. The items below are a few correlations that stood out for Blue Hills, not a ranked or complete list of what matters most.
Density combined with diversity predicts Democratic voting. Non-Hispanic white share in Blue Hills is about 17%, about 55 points below the U.S. average of 72%. A high never-married share predicts Democratic voting, and about 54% of adults in Blue Hills have never been married, above 87% of neighborhoods. Blue Hills runs against the grain of Missouri, a Democratic-leaning pocket in a Republican-leaning state.
Developed land and Democratic lean
Places with a heavily developed built environment tend to lean Democratic; Blue Hills, Kansas City, MO sits in the top quarter nationally on this measure. Developed land does not change how people vote; it mostly reflects how urban a place is.
Why turnout in Blue Hills looks the way it does
Turnout in Blue Hills sits close to the national pattern. Routine healthcare access, homeownership, education, and food security all land near their national averages here. Learn more about the findings and methodology on the political spectrum map.
Nearby Neighborhoods
- Eastern 49-63, Kansas City, MO D+72
- North Town Fork Creek, Kansas City, MO D+84
- Western 49-63, Kansas City, MO D+64
- South Plaza, Kansas City, MO D+51
- Blenheim Square, Kansas City, MO D+79
- Southmoreland, Kansas City, MO D+70
- Oak Park Northwest, Kansas City, MO D+83
- West Plaza, Kansas City, MO D+56
- East Meyer, Kansas City, MO D+80
- Tower Homes, Kansas City, MO D+67
Neighborhoods with Similar Populations
- North, Helena, MT R+3
- Saint Claire-Superior, Cleveland, OH D+76
- South Fountain Avenue Historic District, Springfield, OH D+40
- Pulaski Park, Hammond, IN D+18
- Yorkshire Woods, Detroit, MI D+85
- Linda Mar, Pacifica, CA D+39
- Candlewood Park, San Antonio, TX D+29
- Golf Course Terrace, Sacramento, CA D+42
- Starmount Forest, Greensboro, NC D+39
- Americana, Oak Ridge, FL D+57
Sources and methodology
Precinct-level voting records used to fit the model come from Missouri Secretary of State, Elections, distributed by the Voting and Election Science Team. Demographic inputs come from the U.S. Census Bureau (ACS 5-year estimates and the 2020 Decennial Census). Health and environmental inputs come from the CDC (PLACES and the Environmental Justice Index). Land cover comes from the USGS and EPA. Election-day and lead-up weather come from PRISM 4km daily grids and the NOAA Global Historical Climatology Network. Mail-voting and election-administration patterns come from the MIT Election Lab's Survey of the Performance of American Elections. Block-group crime detail comes from CrimeGrade. Internet data and modeling support provided by ISPreports.org.
Modeling and analysis by the BestNeighborhood data science team. Full methodology and findings: political spectrum map.
Methodology reviewed by the BestNeighborhood data team. Last updated May 2026.