
Low unemployment
High unemployment
High unemployment
Colorblind friendly
off
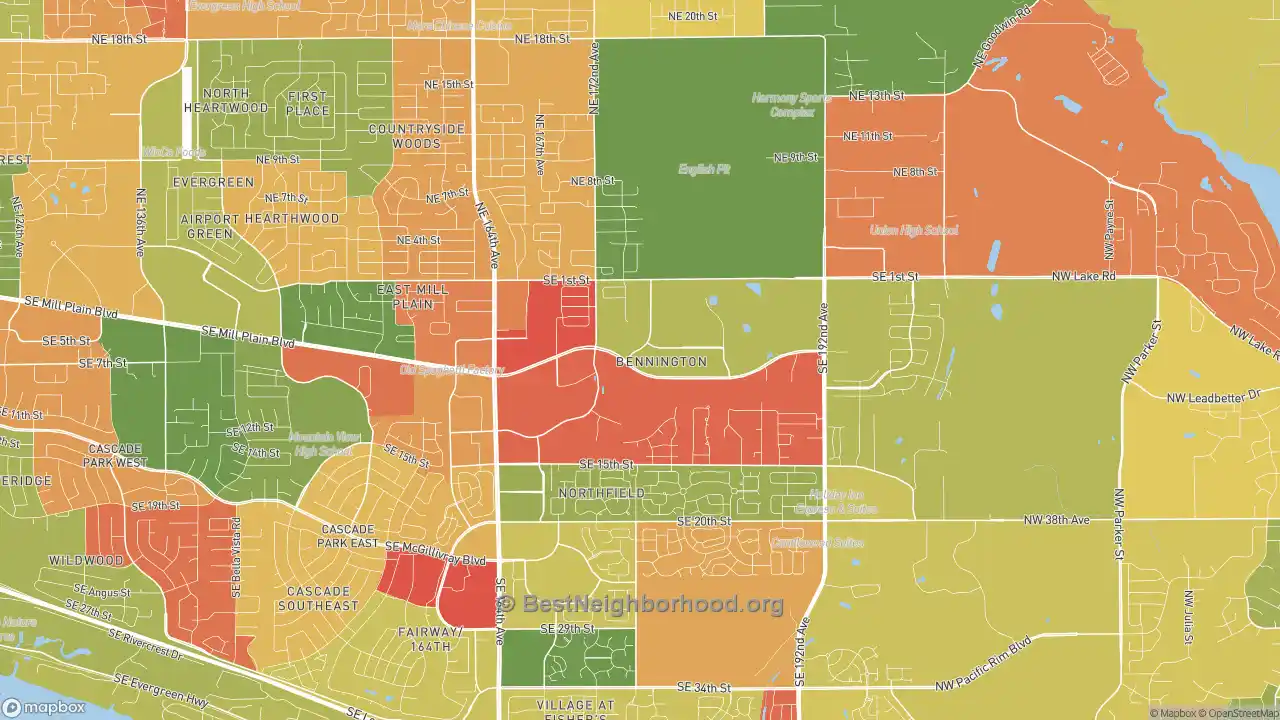
The employment rate in Bennington, Vancouver, WA, is currently 88.60%. On our map, you can see the unemployment rate by neighborhood. Red areas mean unemployment rates of 10-20% and higher, while the yellow range from 5-9%. Green areas of Bennington are 0-5%. These rates are based on working-age people in Bennington actively looking for non-military employment.
Nearby Neighborhoods
- Fishers Landing East, Vancouver, WA
- Fisher-Mill Plain-Fisher's Village, Vancouver, WA
- Cascade Highlands, Vancouver, WA
- Countryside Woods, Vancouver, WA
- Mountain View, Vancouver, WA
- Fircrest, Vancouver, WA
- Burnt Bridge Creek, Vancouver, WA
- Landover-Sharmel, Vancouver, WA
- Image, Vancouver, WA
- Ellsworth Springs, Vancouver, WA
Neighborhoods with Similar Populations
- Olive Drive Area, Bakersfield, CA
- Stanwood Park, South Portland, ME
- Forest Trails, Jacksonville, FL
- Freestate-North Highlands, Shreveport, LA
- Downtown West, St. Louis, MO
- Greeneville Historic District, Norwich, CT
- Hansen, Mountain House, CA
- Hudson Avenue Historic District, Newark, OH
- Canton, Salisbury, MD
- Camp Curtin, Harrisburg, PA
No other site shows detail at this level for free. We are able to keep this site free by receiving a small commission from the referring links on this page. Please share or cite this page if you aren’t able to otherwise support our work. Note that big changes are coming to this page in particular to add much more detail.
Updated 2023 using the most recent data available (2021)