
Low unemployment
High unemployment
High unemployment
Colorblind friendly
off
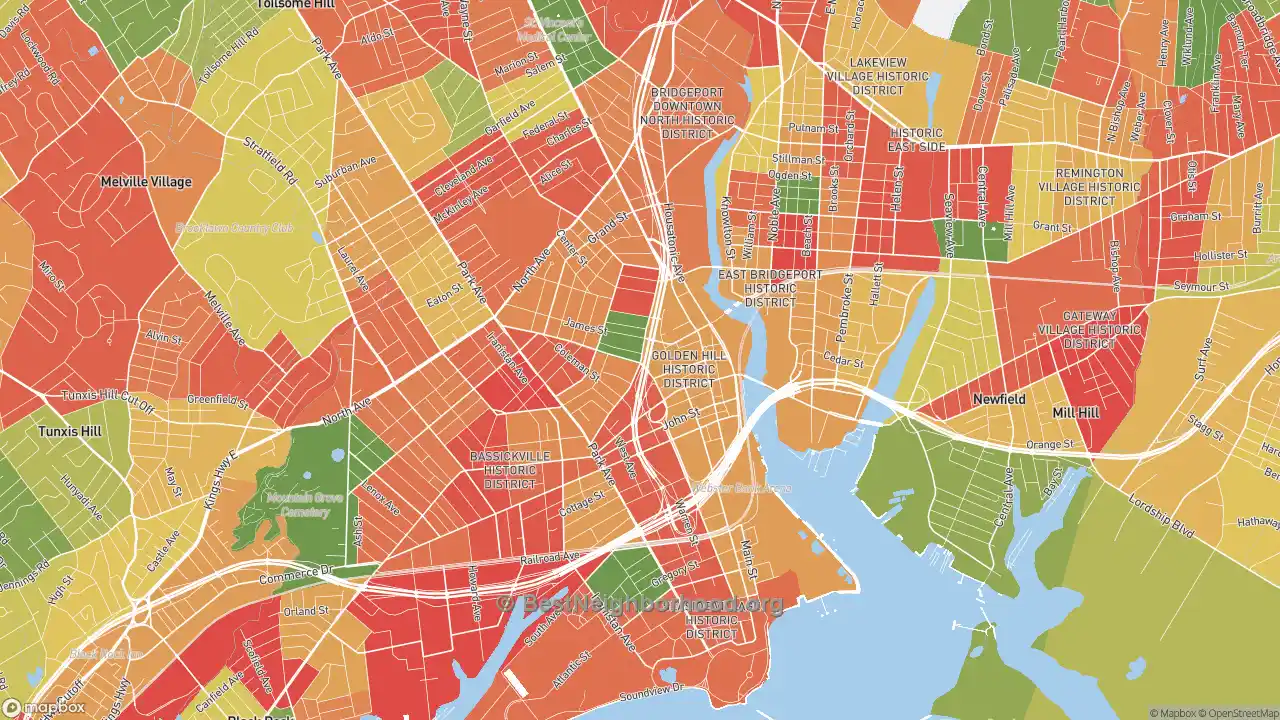
The employment rate in Downtown Bridgeport, Bridgeport, CT, is currently 89.57%. On our map, you can see the unemployment rate by neighborhood. Red areas mean unemployment rates of 10-20% and higher, while the yellow range from 5-9%. Green areas of Downtown Bridgeport are 0-5%. These rates are based on working-age people in Downtown Bridgeport actively looking for non-military employment.
Nearby Neighborhoods
- Bassickville Historic District, Bridgeport, CT
- Brooklawn-St. Vincent, Bridgeport, CT
- South End, Bridgeport, CT
- East Side-Bridgeport, Bridgeport, CT
- East End, Bridgeport, CT
- Boston Avenue-Mill Hill, Bridgeport, CT
- North Bridgeport, Bridgeport, CT
- Black Rock, Bridgeport, CT
- Reservoir-Whiskey Hill, Bridgeport, CT
- North End, Bridgeport, CT
Neighborhoods with Similar Populations
- Near N Valley, Albuquerque, NM
- Tree Streets, Provo, UT
- Cloverdale Watson, Little Rock, AR
- Coral Ridge Country Club Estates, Fort Lauderdale, FL
- Downtown Huntington Beach, Huntington Beach, CA
- North Shore Waialua, Waialua, HI
- North Delridge, Seattle, WA
- New Tampa, Tampa, FL
- Hillandale, Silver Spring, MD
- Abram-Perezville, Mission, TX
No other site shows detail at this level for free. We are able to keep this site free by receiving a small commission from the referring links on this page. Please share or cite this page if you aren’t able to otherwise support our work. Note that big changes are coming to this page in particular to add much more detail.
Updated 2023 using the most recent data available (2021)