
See which neighborhoods in your service area have the highest household incomes, neighborhood by neighborhood, then send your mailers, door hangers and ads where incomes fit your prices.
Enter your city or ZIP code to see its income, homeownership and home age maps together:
Free, with no sign-up, for cities, towns, ZIP codes and neighborhoods across the US.

Three maps that show where your customers live
BestNeighborhood has maps like these for cities, towns, ZIP codes and neighborhoods across the US. Here are three for ZIP code 28277 in Charlotte, NC, where the median household income is $139,528 and neighborhood medians run from $57,146 to $237,219.
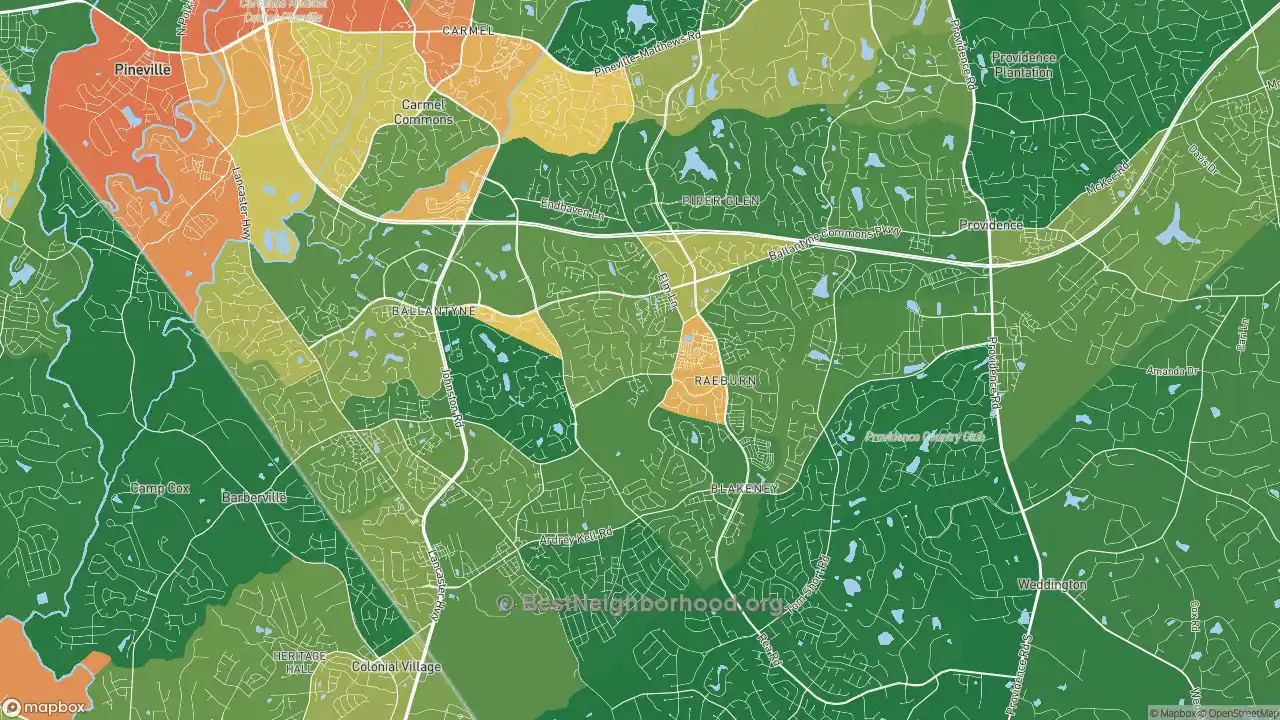
1. Who can afford you
Median household income for each part of the ZIP code. The greener the area, the higher the income.
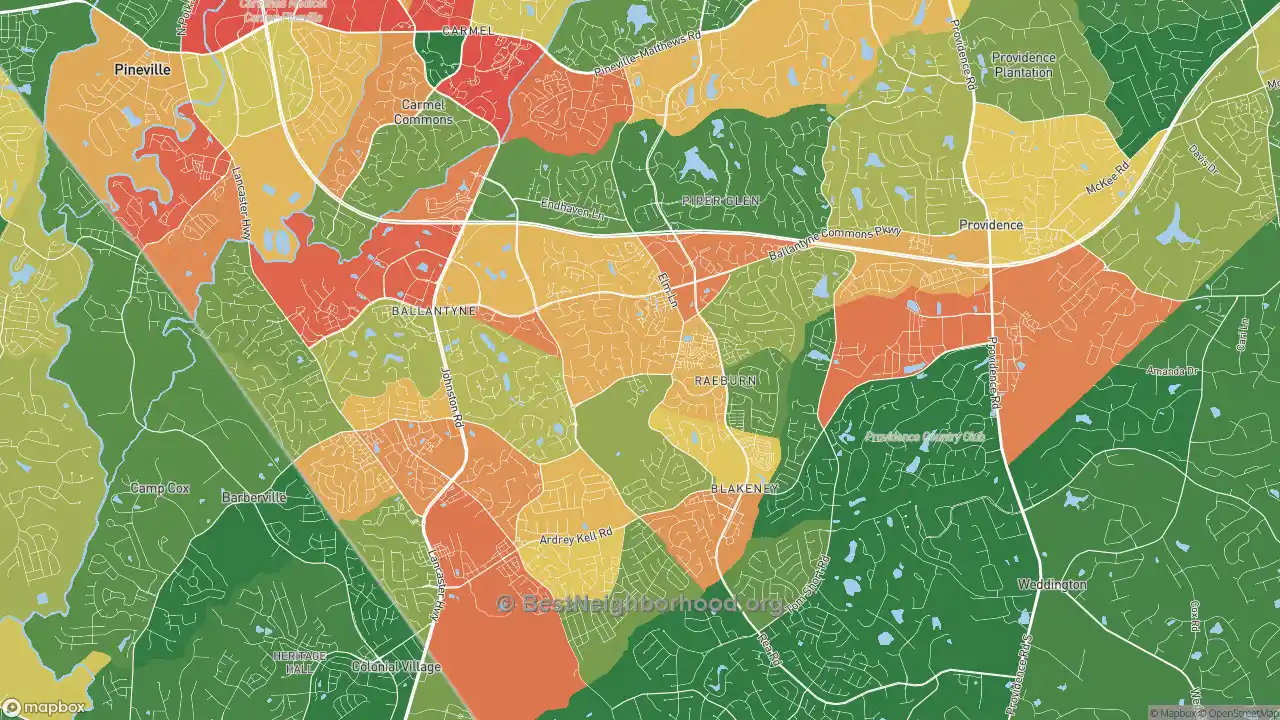
2. Who owns their home
If you work for homeowners, look for green: those areas are mostly owner-occupied.
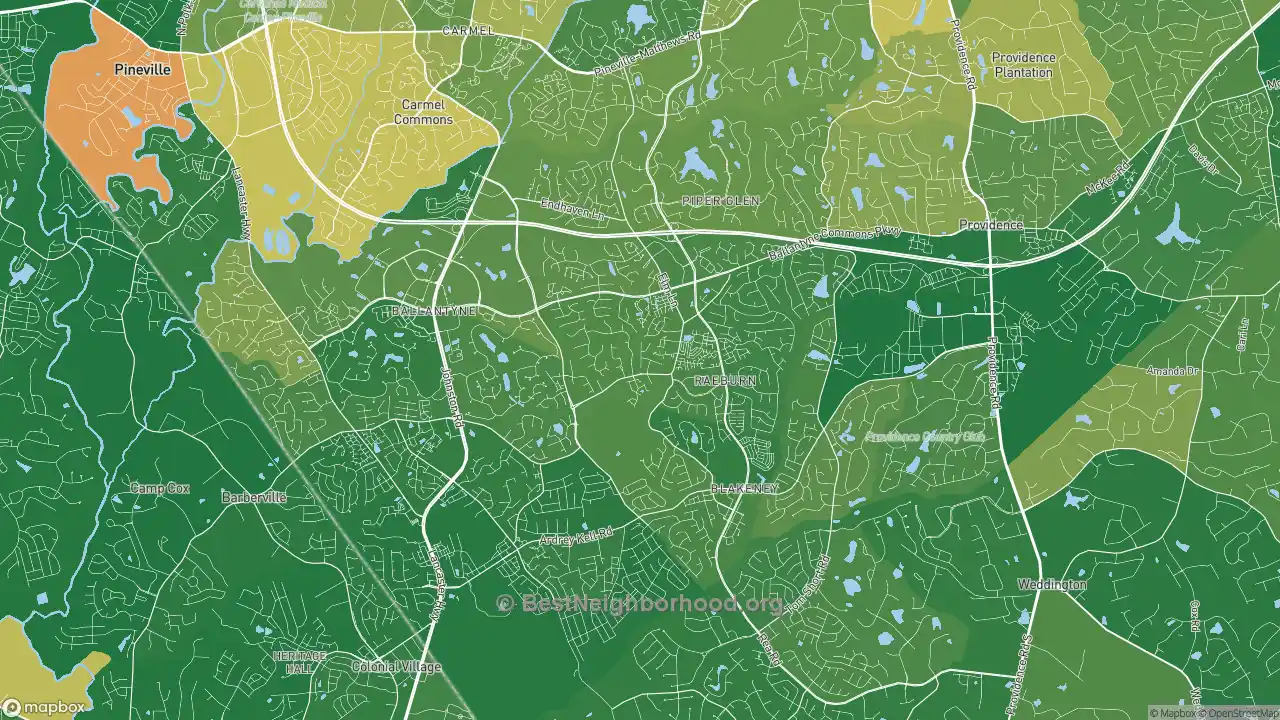
3. How old the homes are
Useful when your work depends on a home’s age, such as roofing, windows or remodeling. The redder the area, the older its homes.
Search above to see these three maps for your own city, town or ZIP code, side by side. Each map opens its full interactive version.
Why a ZIP code average is not enough
A ZIP code’s median household income hides a wide spread. In each of these six ZIP codes, the highest-income neighborhood’s median is more than three times the lowest’s, so it pays to look inside a ZIP code before you mail or advertise to all of it.
Median household income of the lowest-income and highest-income neighborhoods in each ZIP code, from BestNeighborhood’s income maps. $250k+ means $250,000 or more, the highest value the Census Bureau reports.
See the numbers
ZIP code |
Lowest-income neighborhood |
Whole ZIP code |
Highest-income neighborhood |
|---|---|---|---|
10025, New York, NY |
$13,173 |
$133,180 |
$250,000 or more |
43215, Columbus, OH |
$16,335 |
$83,786 |
$134,750 |
98052, Redmond, WA |
$57,033 |
$175,178 |
$250,000 or more |
28277, Charlotte, NC |
$57,146 |
$139,528 |
$237,219 |
84095, South Jordan, UT |
$58,606 |
$146,251 |
$219,141 |
60614, Chicago, IL |
$64,514 |
$156,129 |
$250,000 or more |
Turn the map into a marketing plan
Direct mail
The U.S. Postal Service’s Every Door Direct Mail tool lets you choose mail carrier routes on a map and filter them by age, income or household size. Use the income map to decide which parts of town to search, then pick the routes that cover them.
Online ads
Google Ads and Meta both let you target ads by ZIP code. Open the income map for each ZIP code you serve and put more of your budget where incomes fit your prices. Google Ads does not allow ZIP code targeting for housing, job or credit ads.
Door hangers and canvassing
Plan your routes through the green areas nearest you first, then work outward. The map shows where higher-income areas start and stop, so a route can follow those edges instead of a ZIP code line.
Popular income maps
- New York, NY
- Los Angeles, CA
- Chicago, IL
- Houston, TX
- Phoenix, AZ
- Philadelphia, PA
- San Antonio, TX
- Dallas, TX
- Austin, TX
- Charlotte, NC
- Denver, CO
- Seattle, WA
- Boston, MA
- Atlanta, GA
- Washington, DC
See income for every city and state
Other maps that help
- Home prices: home values and the most affordable neighborhoods in any city or ZIP code.
- Demographics: household size, age, renters, the age of homes, education and jobs.
- Rent prices: what rent costs across a city or ZIP code.
Common questions
Is it free?
Yes. The maps are free to look up, with no sign-up.
Can my business use these maps?
Yes, to plan your own marketing: look up the places you serve and decide where to advertise. Our Terms of Use do not allow copying the data into lists, spreadsheets or databases. If you quote a figure, credit BestNeighborhood.org with a link to the page it came from.
Where do the numbers come from?
They are BestNeighborhood calculations from the U.S. Census Bureau’s American Community Survey (ACS) 2020-2024 5-year estimates.
Can I get a list of the best areas in my service area?
Not yet. If a ranked list of the neighborhoods or ZIP codes you serve would help, tell us what you would use it for.
Sources
- U.S. Census Bureau, American Community Survey 2020-2024 5-Year Estimates, Table B19013: Median Household Income in the Past 12 Months. data.census.gov
- U.S. Postal Service, Every Door Direct Mail. usps.com
- Google Ads Help, Target ads to geographic locations. support.google.com
- Meta Business Help Center, About location targeting. facebook.com