
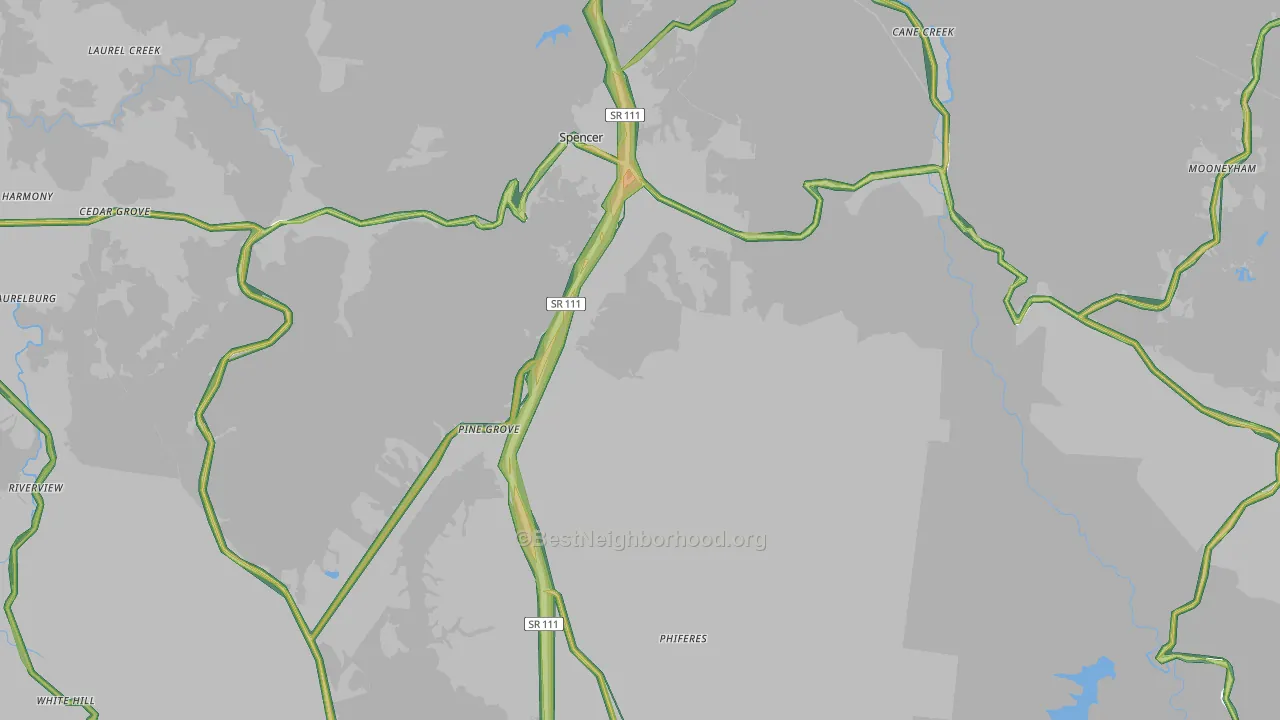
This map shows modeled outdoor noise across Van Buren County at 100-meter resolution, combining road, aviation, and rail sources. Green areas measure below 45 dBA. Orange and red exceed the EPA's 55 dBA outdoor threshold linked to long-term health effects. Use the layer toggles to view each source on its own or all together.
What the numbers sound like
- 30 dBAWhisper
- 40 dBASoft rainfall
- 45 dBAQuiet suburban street at night
- 50 dBAQuiet office
- 55 dBAEPA outdoor threshold: light traffic 100 ft away
- 60 dBANormal conversation an arm's length away
- 65 dBABusy restaurant
- 70 dBAHighway traffic 50 ft away
- 80 dBACity bus interior
Population Above the EPA Outdoor Threshold
The EPA's 55 dBA outdoor reference level is a common benchmark for residential noise exposure, especially for activity interference, annoyance, and long-term community noise concerns. About 198 Van Buren County residents, or 3.3%, live above that level. By land area, 6.7% of Van Buren County is above 55 dBA.
See how noise in Van Buren County compares to similar-sized counties.
Noise by Part of Van Buren County
Average noise levels for Van Buren County residents, grouped by direction from the center of Van Buren County. The highest population-weighted average is in northern Van Buren County; the lowest is in eastern Van Buren County, where just 0% of residents live in blocks above the EPA's 55 dBA threshold, a third of the share in the loudest section.
Northern Van Buren County
1% of people above 55 dBA
Northwestern Van Buren County
1% of people above 55 dBA
Southwestern Van Buren County
1% of people above 55 dBA
Northeastern Van Buren County
1% of people above 55 dBA
Eastern Van Buren County
0% of people above 55 dBA
To the human ear, noise in northern Van Buren County sounds about 41% louder than in eastern Van Buren County, a 5.0 dBA gap. Every 10 dBA roughly doubles perceived loudness. Within any of these directions, two homes a quarter mile apart can still differ by 10 or more dBA depending on how close they sit to a major highway.
Loudest Road Corridors
The model evaluates every road in Van Buren County using federal traffic counts, posted speeds, heavy-truck ratios, and pavement type. The source level shown is the modeled noise at the road centerline, where it is loudest. Noise drops with distance, faster in vegetated areas and slower over open pavement.
How far back from A131 do you need to be?
A131 produces an estimated 60 dBA at its loudest centerline points. Noise drops logarithmically with distance, with the exact rate depending on what's between you and the road. Tree cover, walls, terrain, and pavement type all matter. At roughly a quarter mile back, traffic fades into the noise level of a soft rainfall.
Calculated from the model's calibrated attenuation formula. About 50% of Van Buren County sits under tree canopy (much heavier than most counties) and roughly 2% is impervious surface like pavement and rooftops. Both are folded into the per-place decay rate above. Heavier canopy pulls noise down faster with distance; impervious surfaces slow the drop.
How Noise Is Distributed Across Van Buren County
The bar chart below shows the share of Van Buren County residents in each noise band. About 98% of residents live below the EPA's 55 dBA threshold, and roughly 0% live in blocks above 60 dBA. Long-term exposure in that range is linked to elevated stress hormones and cardiovascular risk.
How Van Buren County Compares
Van Buren County sits at the quieter end of the spectrum. Below: how Van Buren County's average outdoor noise and share of residents above the EPA threshold compare with Bledsoe County, Grundy County, Sequatchie County, and Moore County.
Average noise level (dBA)
Van Buren County's 42.3 dBA pop-weighted average is at the quieter end of the spectrum. Tennessee as a whole averages 49.2 dBA and the U.S. averages 52.0 dBA. Both are lower than Van Buren County because most of either area is rural land away from major roads.
Share of residents above 55 dBA
About 3.3% of Van Buren County residents live in blocks where outdoor levels exceed the EPA's 55 dBA threshold. That's in the middle of its peer group. Measured by land area instead, 6.7% of Van Buren County's footprint sits above 55 dBA, against a Tennessee average of 18.7% and a national average of 28.1%.
What This Means if You're Moving to Van Buren County
- Distance from highways matters more than the neighborhood name. Two homes in the same zip code can differ by 20 dBA if one sits 100 meters from A131 and the other 500 meters away. The model captures this at 100-meter resolution, so noise exposure changes block by block.
- Tree canopy can help reduce modeled noise exposure. Roughly 50% of Van Buren County is under tree cover (much heavier than most counties), and the dominant land cover is deciduous forest. Both are measured from federal USDA Forest Service and USGS satellite imagery at 30-meter resolution. Streets with 60% or higher canopy show 3 to 5 dBA lower noise than comparable streets with bare ground or pavement, which is why the per-place decay rate above already accounts for it.
Sources & Methodology
The BestNeighborhood noise model is calibrated against nearly one million federal ground-truth measurements across four states. Road noise is computed from segment-level federal traffic data and propagated outward using physics-based acoustic decay, with attenuation rates that depend on the surrounding land cover.
Federal datasets used:
FHWA Highway Performance Monitoring System: road geometry, traffic counts, lane configuration
U.S. DoT Bureau of Transportation Statistics National Transportation Noise Map: aviation and rail noise, road calibration ground truth
USGS / MRLC National Land Cover Database: land cover and impervious surface coverage
USDA Forest Service Tree Canopy Cover: vegetation density for sound propagation
U.S. Census Bureau TIGER/Line: block-level geography and population
U.S. EPA Levels Document: 55 dBA outdoor reference level
All inputs are published federal datasets. Block-level noise is computed by combining road, rail, and aviation sound sources in the energy domain, the same physics used in professional environmental noise assessments. Read the full methodology.