
Higher income
Lower income
Lower income
Colorblind friendly
off
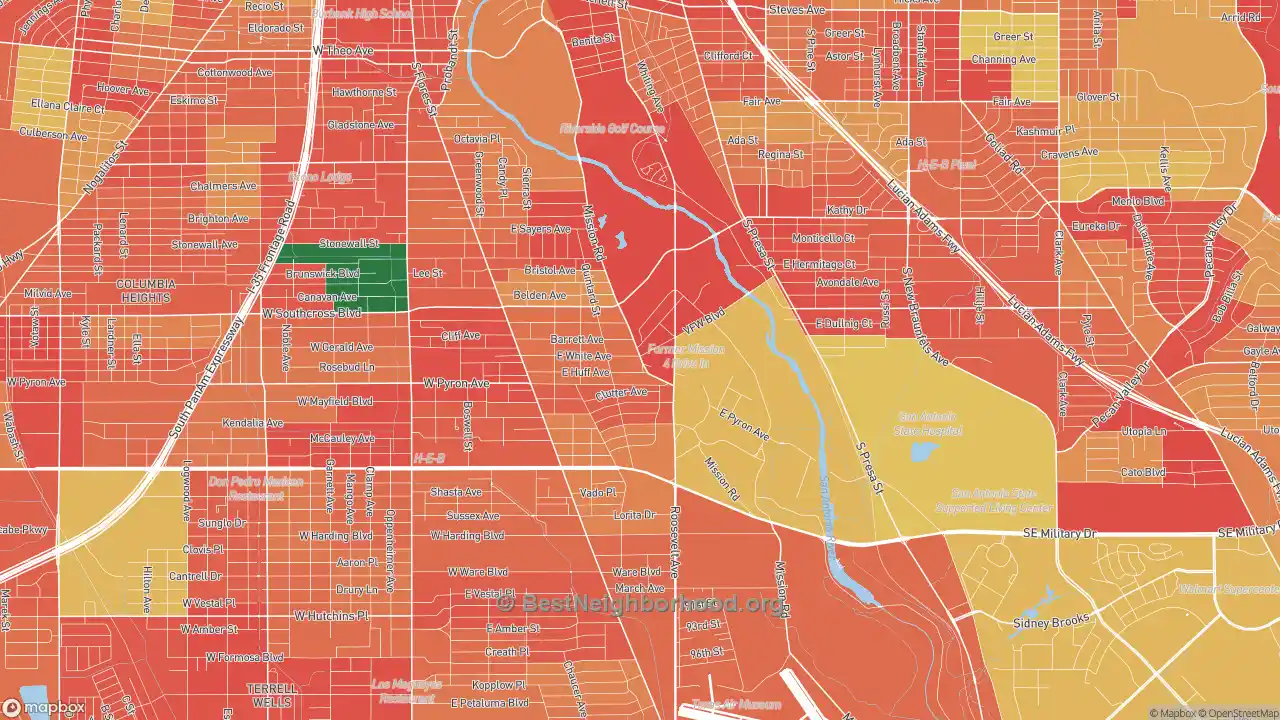
The per capita income in Mission San Jose, San Antonio, TX is $13,702 annually. Our map shows which parts of the neighborhood are lower or higher than this average. High-earning areas are in green, and low-earning areas of Mission San Jose are in red. Per-capita income differs from household income in that it will appear lower in areas with more children and where only one adult is employed.
Nearby Neighborhoods
- Riverside South, San Antonio, TX
- Hot Wells, San Antonio, TX
- Highland Park, San Antonio, TX
- Terrell Wells, San Antonio, TX
- Kingsborough Ridge, San Antonio, TX
- Tierra Linda, San Antonio, TX
- Columbia Heights, San Antonio, TX
- Highland Hills, San Antonio, TX
- Lone Star, San Antonio, TX
- Palm Heights, San Antonio, TX
Neighborhoods with Similar Populations
- Indian Lake East, Worcester, MA
- Spirit Valley-Denfeld-Norton Park, Duluth, MN
- Southwest, San Antonio, TX
- Los Jardines, San Antonio, TX
- Lamar Heights Area, Arvada, CO
- La Jolla Village, La Jolla, CA
- Kennydale, Renton, WA
- Kaisertown, Buffalo, NY
- Jefferson-Woodlawn Lake, San Antonio, TX
- Indianola Hills, Des Moines, IA
No other site shows detail at this level for free. We are able to keep this site free by receiving a small commission from the referring links on this page. Please share or cite this page if you aren’t able to otherwise support our work. Note that big changes are coming to this page in particular to add much more detail.
Updated 2023 using the most recent data available (2021)