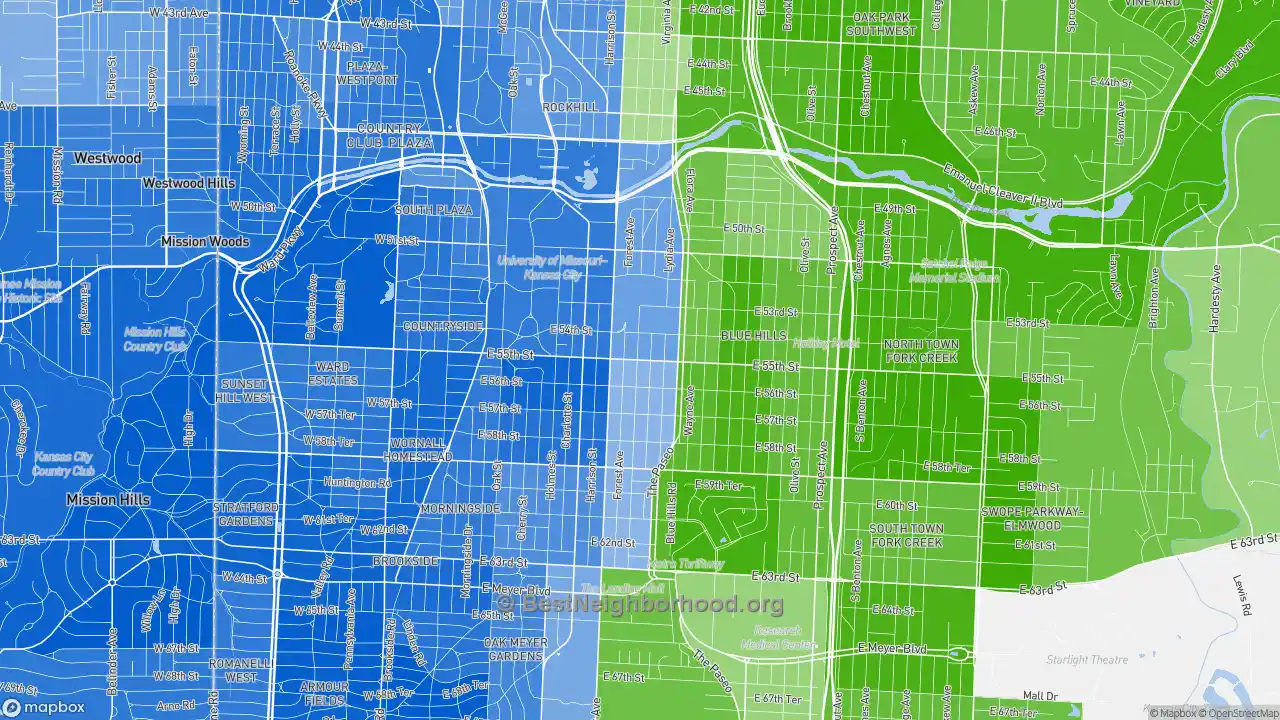
The map below shows majority race by area in Eastern 49-63, as self-identified on the US census. Darker shades indicate a larger racial majority in that neighborhood. This page also contains data and maps on Eastern 49-63 racial diversity and diversity scores. Click here to scroll to diversity data.
WhiteHispanicBlackAsianMultiple/Other
Majority race by area
The majority race in Eastern 49-63 overall is white, making up 52.8% of residents. The next most-common racial group is black at 31.7%. There are more white people in the west areas of the neighborhood. People who identify as black are most likely to be living in the southeast places. The data below shows how many people identify themselves as each of the following races, which most Americans base on their family's national origin:
Race in Eastern 49-63
Self-Identified Race |
Eastern 49-63, Kansas City, MO Population |
|---|---|
White |
52.8% |
Hispanic |
4.3% |
Black |
31.7% |
Asian |
4.3% |
Native American |
0.9% |
Other |
5.9% |
Diversity and Diversity Scores for Eastern 49-63, Kansas City, MO
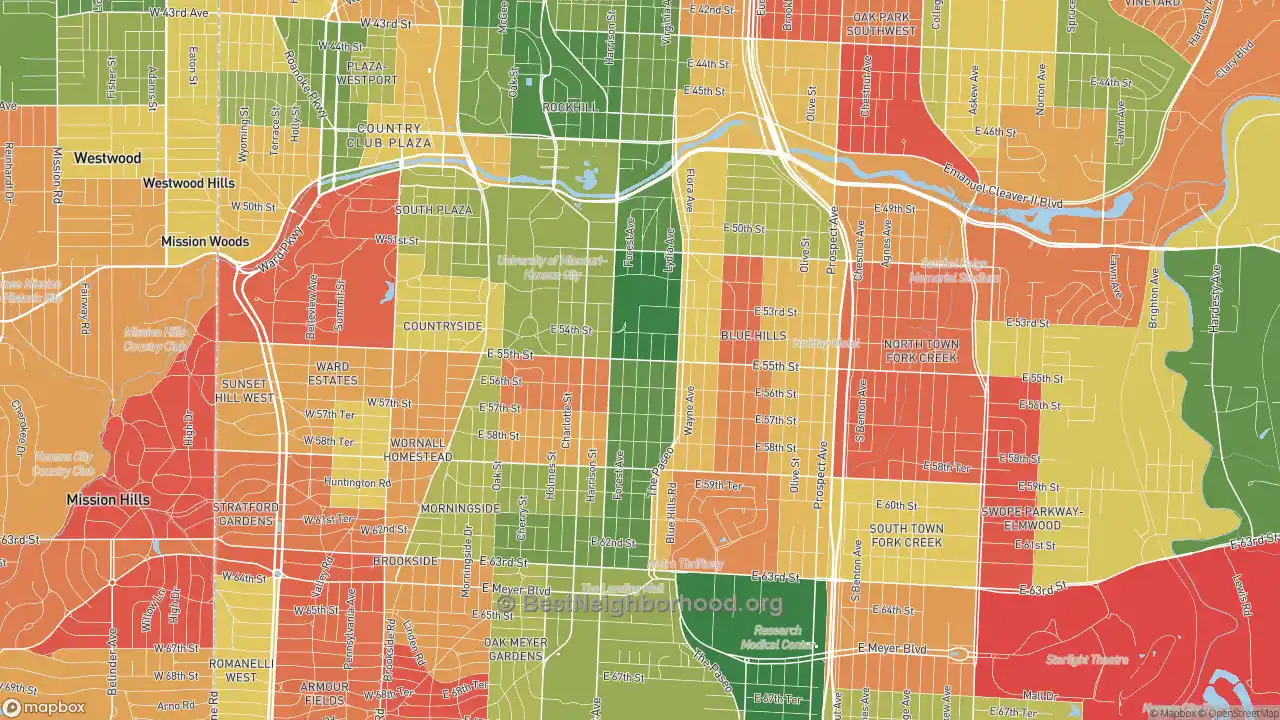
The map below shows diversity in Eastern 49-63. Areas in green are more diverse, while areas in red are much less diverse. Diversity, in this case, means a mixture of people with different race and ethnicity living close to one another. For example, all-black and all-white areas in the neighborhood would both be considered lacking diversity.
More diverse
Less diverse
Colorblind friendly
off
Eastern 49-63 Diversity Score
74
With a diversity score of 74 out of 100, Eastern 49-63 is more diverse than other US neighborhoods. The most diverse area within Eastern 49-63's proper boundaries is to the north of the neighborhood. The least diverse areas are located in the southeast parts of Eastern 49-63.
Data Sources: U.S. Census, proprietary data mapping and analysis. Special thanks to the University of Virginia.
Nearby Neighborhoods
- Western 49-63, Kansas City, MO: less diverse
- Blue Hills, Kansas City, MO: less diverse
- South Plaza, Kansas City, MO: less diverse
- North Town Fork Creek, Kansas City, MO: less diverse
- Southmoreland, Kansas City, MO: less diverse
- Blenheim Square, Kansas City, MO: less diverse
- West Plaza, Kansas City, MO: less diverse
- East Meyer, Kansas City, MO: less diverse
- Tower Homes, Kansas City, MO: less diverse
- Oak Park Northwest, Kansas City, MO: less diverse
Neighborhoods with Similar Populations
- Albion Place, Clifton, NJ: less diverse
- Allwood, Clifton, NJ: less diverse
- Ridgewood, Madison, WI: more diverse
- Pines Village, New Orleans, LA: less diverse
- Pinewood-West Palm Beach, West Palm Beach, FL: less diverse
- Pioneer Square, Seattle, WA: more diverse
- Placerdale, Chicago, IL: less diverse
- Princess Jeanne, Albuquerque, NM: more diverse
- Randall Hills, North Aurora, IL: less diverse
- Raymond Park, Indianapolis, IN: more diverse