The map below shows majority race by area in Moon Lake Estates, as self-identified on the US census. Darker shades indicate a larger racial majority in that neighborhood. This page also contains data and maps on Moon Lake Estates racial diversity and diversity scores. Click here to scroll to diversity data.

WhiteHispanicBlackAsianMultiple/Other
Majority race by area
The majority race in Moon Lake Estates overall is white, making up 74.2% of residents. The next most-common racial group is hispanic at 19.0%. There are more white people in the southeast areas of the neighborhood. People who identify as hispanic are most likely to be living in the central places. The data below shows how many people identify themselves as each of the following races, which most Americans base on their family's national origin:
Race in Moon Lake Estates
Self-Identified Race |
Moon Lake Estates, Moon Lake, FL Population |
|---|---|
White |
74.2% |
Hispanic |
19.0% |
Black |
3.2% |
Asian |
0.3% |
Native American |
0.2% |
Other |
3.1% |
Diversity and Diversity Scores for Moon Lake Estates, Moon Lake, FL
The map below shows diversity in Moon Lake Estates. Areas in green are more diverse, while areas in red are much less diverse. Diversity, in this case, means a mixture of people with different race and ethnicity living close to one another. For example, all-black and all-white areas in the neighborhood would both be considered lacking diversity.
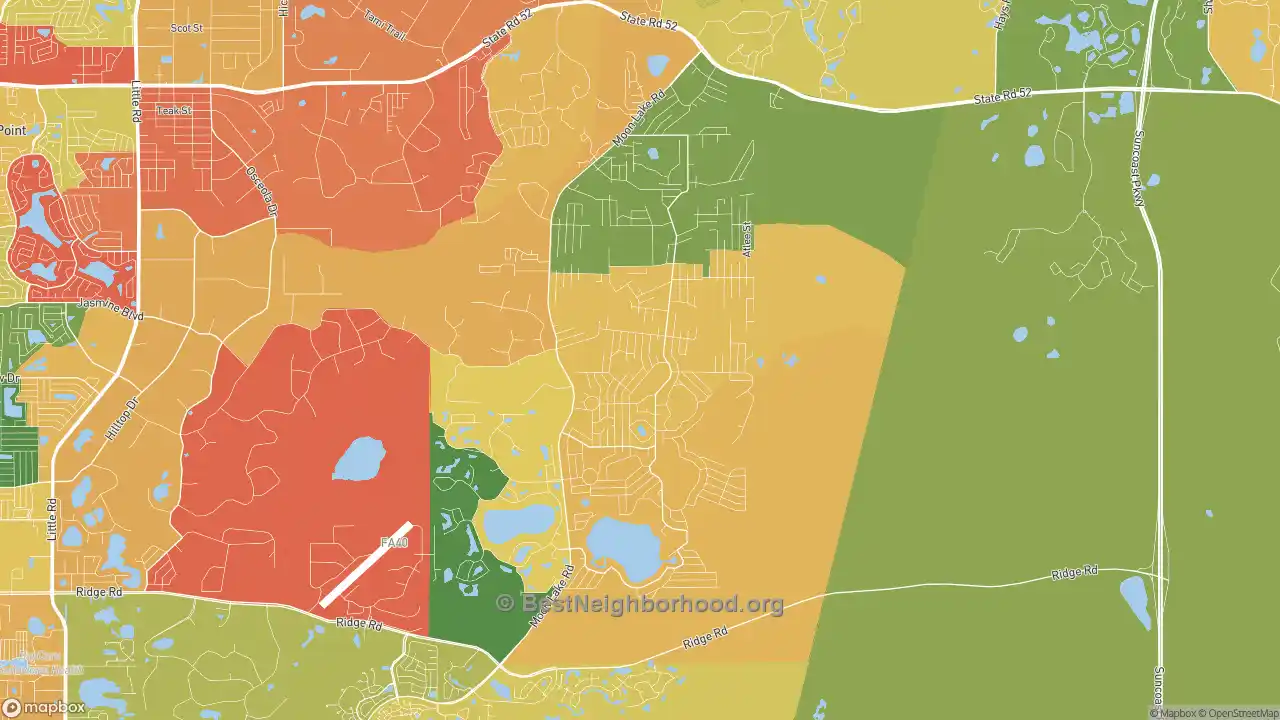
More diverse
Less diverse
Colorblind friendly
off
Moon Lake Estates Diversity Score
21
With a diversity score of 21 out of 100, Moon Lake Estates is less diverse than other US neighborhoods. The most diverse area within Moon Lake Estates's proper boundaries is to the northeast of the neighborhood. The least diverse areas are located in the southeast parts of Moon Lake Estates.
Data Sources: U.S. Census, proprietary data mapping and analysis. Special thanks to the University of Virginia.
Nearby Neighborhoods
- Embassy Hills, Jasmine Estates, FL: more diverse
- Seven Oaks, Wesley Chapel, FL: more diverse
- Carrollwood, Tampa, FL: more diverse
- West Meadows, Tampa, FL: more diverse
- Cross Fletcher, University, FL: more diverse
- Tampa Palms, Tampa, FL: more diverse
- Forest Hills, Tampa, FL: more diverse
- Meadow Point, Wesley Chapel, FL: more diverse
- Hunters Green, Tampa, FL: more diverse
- North Tampa, Tampa, FL: more diverse
Neighborhoods with Similar Populations
- Downtown San Antonio, San Antonio, TX: more diverse
- Stockdale Greens, Bakersfield, CA: more diverse
- Stetson Hills, Colorado Springs, CO: more diverse
- State Fair, Pueblo, CO: more diverse
- Southeast Mill Creek, Salem, OR: more diverse
- Southdale, Edina, MN: more diverse
- South End Springfield, Springfield, MA: less diverse
- Indian Hills Riverbend, Wichita, KS: more diverse
- Homeland, Baltimore, MD: more diverse
- Grafton Hill, Worcester, MA: more diverse