
Last updated .
The BestNeighborhood flood map shows how many residents of every US state, county, city, ZIP code and neighborhood live in FEMA’s high-risk flood zone, the ground with a 1% or greater chance of flooding each year. It covers about 95,000 places, Alaska, Hawaii and Puerto Rico included, by reading FEMA’s flood zones at 10-meter detail under 5.8 million inhabited Census blocks, and it adds the 2.1 million federal flood insurance claims paid since 1978.
This page is for people who live in a place, or are thinking of moving there, and want to know how exposed it is to flooding from rivers, bayous, creeks and the sea. It also sets out what the map found across the country, how it is made and where it is weak.
Type a city or ZIP code to open its flood map, with its flood zones, the waterways behind them and its flood insurance claims:
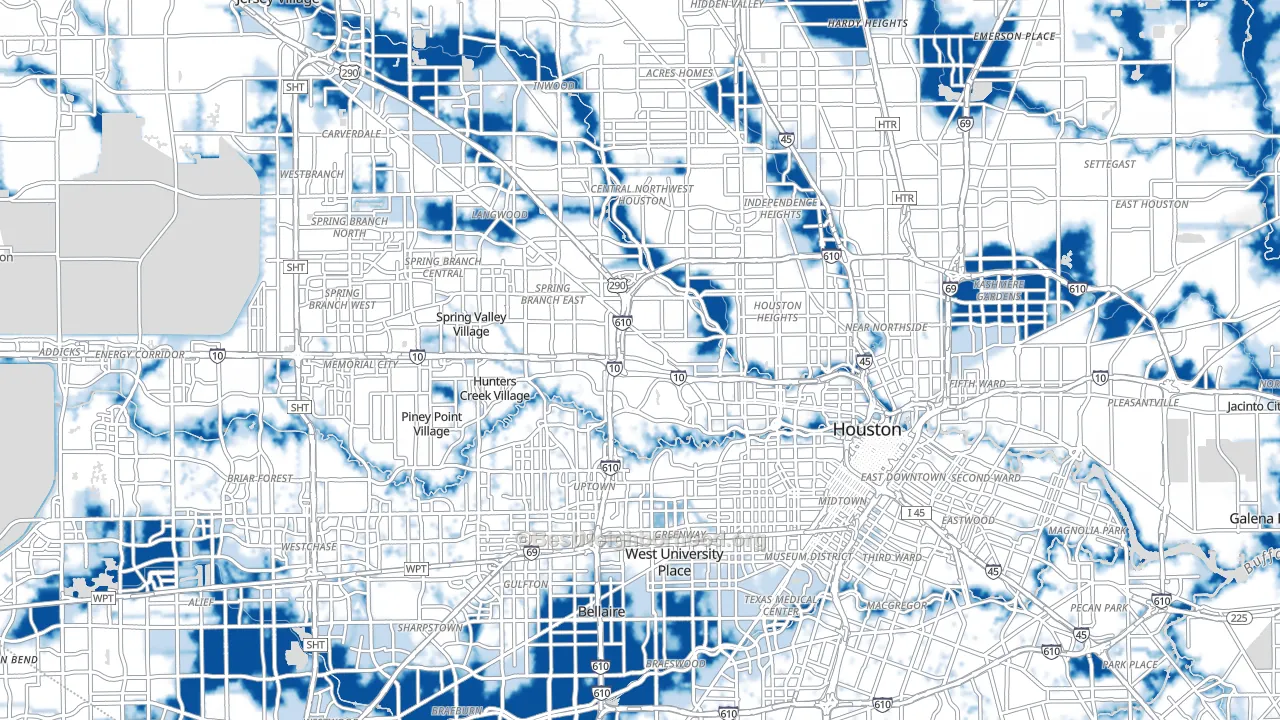
The flood map of the Houston area. Dark blue is FEMA’s high-risk zone, light blue moderate risk and white minimal risk. Grey ground, such as the Addicks and Barker reservoirs at the left edge, has no value. Meyerland, at the bottom near Loop 610, and River Oaks, west of downtown, sit about six miles apart.
On this page
- A quarter of flood claims come from outside the high-risk zone
- Fewer than half the homes in the zone carry federal flood insurance
- 18.4 million Americans live in the 100-year floodplain
- ZIP codes inside one county can differ more than whole states do
- Lower-income neighborhoods sit in the zone more often, except in Florida
- Why flood risk matters
- How to read the flood map
- How the map is made, and what it leaves out
- Sources
- Flood maps by state, metro area and county
A quarter of flood insurance claims come from outside FEMA’s high-risk zone
Many buyers read “outside the flood zone” as “safe from floods.” The federal flood insurance record says otherwise. Since 1978 the National Flood Insurance Program has paid 2.1 million claims, $90 billion in all. Of the paid claims whose zone is known, 509,204, or 25%, came from buildings outside FEMA’s high-risk zone. That is one paid claim in four.
FEMA, sorting claims by today’s maps rather than the map in force at the time of the loss, puts the share at 29% for 2014 to 2024. The share holds in every decade, from 17% to 33%. It peaks in storms that flood by rain. 52% of Hurricane Harvey’s paid claims and half of Tropical Storm Allison’s in 2001 came from outside the zone, against 14% for Hurricane Sandy and 6% for Hurricane Ian, whose water came mostly from the sea. In Harris County, Texas, home to Houston, 53% of all paid claims came from outside the high-risk zone. The claims are not small. The median paid claim outside the zone was $12,169, against $15,000 inside it, in dollars of the year paid, not adjusted for inflation.
Share of paid flood insurance claims from buildings outside FEMA’s high-risk zone, 1978 to 2026, for the US and the ten counties with the most paid claims. United States 25.3%; Harris County, TX 53.0%; Orleans Parish, LA 22.3%; Jefferson Parish, LA 28.0%; Galveston County, TX 29.3%; Ocean County, NJ 3.4%; Nassau County, NY 28.3%; Pinellas County, FL 4.0%; Lee County, FL 2.3%; Miami-Dade County, FL 9.4%; St. Tammany Parish, LA 22.7%. The zone is the one the policy was rated in at the time of the loss; the 5% of claims with no zone recorded are left out. Source: FEMA National Flood Insurance Program claims (OpenFEMA).
Counties flooded mostly by the sea, such as Ocean County, New Jersey, after Sandy and Lee County, Florida, after Ian, sit at the low end. Harris County, flooded by rain and bayous, sits at the high end. The high-risk zone marks where a flood is most likely. Floods reach well past it.
Fewer than half the homes in the high-risk zone carry federal flood insurance
Federal law requires flood insurance on a building in FEMA’s high-risk zone when it secures a federally backed mortgage in a community that takes part in the National Flood Insurance Program, so many people assume everyone there is covered. FEMA’s own count says 47.9% of the 3.8 million homes in the zone held a program policy in August 2026, counting each residential building once. Outside the zone, 1.25% did: about one home in 80.
Coverage splits along the coast. In the states on the ocean or the Gulf of Mexico, 57.7% of homes in the high-risk zone carry a policy. In the states with no ocean or Gulf shore, 18.7% do. Among the 15 states with the most homes in the zone, South Carolina ranks highest at 85%. In 19 states fewer than one home in five in the zone is insured, among them Ohio at 16.5%, Michigan at 18.4% and West Virginia at 10.3%. The requirement rides on the mortgage, so homes owned outright fall outside it. A FEMA-commissioned RAND study found the same split in 2006: about 49% of single-family homes in the zone insured, and about 1% outside it.
Share of homes in FEMA’s high-risk zone with a National Flood Insurance Program policy, for the US and the 15 states with the most homes in the zone, August 2026. United States 47.9%; Florida 67.0%; Texas 47.5%; California 30.5%; Louisiana 73.1%; New Jersey 63.3%; North Carolina 53.3%; New York 75.5%; Pennsylvania 23.0%; Mississippi 32.8%; South Carolina 85.0%; Ohio 16.5%; Georgia 43.4%; Michigan 18.4%; Alabama 29.4%; West Virginia 10.3%. Policies from private insurers are not counted. FEMA counts homes from its National Structure Inventory, which runs short in some counties and can push a rate too high. Source: FEMA NFIP Residential Penetration Rates (OpenFEMA).
18.4 million Americans live in the 100-year floodplain, where the odds over a mortgage are about 1 in 4
FEMA’s high-risk zone, which FEMA calls the Special Flood Hazard Area, is the 100-year floodplain: ground with at least a 1% chance of flooding in any year. The name makes it sound like a once-a-century event, a confusion the U.S. Geological Survey’s explainer on recurrence intervals takes apart. Over the 30 years of a typical mortgage, a 1% yearly chance adds up to a 26% chance of at least one flood, about 1 in 4. In the 50 states and Washington, DC, 18.4 million residents live with at least those odds, 5.6% of the population, or 1 in 18 people. Another 14.8 million live in FEMA’s moderate-risk zone, the 500-year floodplain.
| Zone | Chance of a flood in a year | Chance over 30 years | US residents | Share |
|---|---|---|---|---|
| High risk: FEMA’s A and V zones, the 100-year floodplain | 1% or more | about 1 in 4 or more | 18.4 million | 5.6% |
| Moderate risk: the shaded X zone, the 500-year floodplain | 0.2% to 1% | about 1 in 17 to 1 in 4 | 14.8 million | 4.5% |
| Moderate-risk ground behind a levee | 0.2% to 1% | about 1 in 17 to 1 in 4 | 7.6 million | 2.3% |
| Minimal risk: the unshaded X zone | under 0.2% | under 1 in 17 | 274.2 million | 82.7% |
| No value on the map | not rated | not rated | 16.4 million | 4.9% |
Residents of the 50 states and Washington, DC, by the flood zone of the ground they live on, counted by 2020 Census block. A levee lowers the chance of a flood but does not remove it.
Florida alone holds 5.3 million of the 18.4 million, 29% of the national total, and a quarter of Floridians live in the zone. The Miami area by itself has 2.3 million residents in the high-risk zone, more than all of Texas at 1.8 million. Inland states carry their share too. 4.2 million people in the zone, more than one in five, live in states with no ocean or Gulf shore. West Virginia’s share, 6.1%, is about the same as Texas’s, 6.2%.
Residents in FEMA’s high-risk zone, in millions, for the 12 states with the most. Florida 5.28, or 24.5% of its residents; Texas 1.81, 6.2%; California 1.31, 3.3%; Louisiana 1.02, 21.9%; New York 0.71, 3.5%; New Jersey 0.61, 6.5%; Georgia 0.45, 4.2%; Massachusetts 0.41, 5.8%; North Carolina 0.39, 3.7%; Pennsylvania 0.36, 2.8%; South Carolina 0.35, 6.9%; Illinois 0.35, 2.7%. Source: BestNeighborhood flood map, from FEMA’s National Flood Hazard Layer and 2020 Census blocks.
ZIP codes inside one county can differ more than whole states do
State figures run from 0.5% of residents in the high-risk zone in Washington, DC, to 24.5% in Florida. Inside many counties the spread is wider. Of the 613 counties with at least five ZIP codes of 5,000 or more residents, 129 have ZIP codes further apart than that, and those counties are home to 95 million people, 29% of the country. In Brooklyn, New York, 2.9% of all residents live in the zone, but in one ZIP code 83.8% do. In Harris County, Texas, the county reads 11.6% and its ZIP codes run from 0% to 80.5%.
Houston shows it on one map. In Meyerland, along Brays Bayou, 44.7% of residents live in the high-risk zone. In River Oaks, six miles to the northeast beside Buffalo Bayou, 0.2% do. A county or city figure is an average of places like these, which is why the map goes down to the street and each ZIP code and neighborhood has a page of its own.
Lower-income neighborhoods sit in the high-risk zone more often, except in Florida
Rank every resident of the 50 states and Washington, DC, by the median household income of their Census block group, and split them into five groups of equal size. The lowest-income fifth has 6.3% of its residents in the high-risk zone and the highest-income fifth 4.8%. Leaving out Florida, the lowest-income fifth has a third more: 5.1% against 3.8%. The pattern holds in states with no ocean or Gulf shore, 3.7% against 2.5%, and in coastal states, 8.3% against 5.7%.
Florida runs the other way. There the highest-income fifth has 29.7% of its residents in the zone and the lowest-income fifth 22.3%. Published research finds the same split. A 2019 national study found economically disadvantaged people more likely to live in flood zones, and coastal flood zones more often home to wealthier and older residents. A 2021 study of 71,901 Census tracts found the places where flood exposure and social vulnerability overlap, home to about 19 million people, mostly rural and across the South.
Share of residents in FEMA’s high-risk zone by the income fifth of their block group, the 50 states and Washington, DC, without Florida: lowest-income fifth 5.1%, second 4.3%, middle 4.2%, fourth 3.9%, highest-income fifth 3.8%. Florida, lowest to highest: 22.3%, 22.2%, 23.5%, 27.5%, 29.7%. The fifths split at block-group median household incomes of $54,796, $73,319, $93,487 and $125,116. Source: BestNeighborhood flood map; U.S. Census Bureau American Community Survey. Income is not an input to the map.
Why flood risk matters
Floods reach nearly every county
In the past 20 years, 99% of US counties have had a flood event, by FEMA’s count. Floods killed an average of 94 people a year over the 30 years to 2025, and 230 in 2025 alone, according to the National Weather Service. Most die on the road: of 4,586 flood deaths in the contiguous US from 1959 to 2005, 63% of those with a known setting happened in vehicles. River and rain floods outside hurricanes cost $203 billion from 1980 to 2024, adjusted for inflation, counting only events of $1 billion or more.
FEMA’s map is a floor, not a ceiling
FEMA’s zones cover the rivers and coasts FEMA has studied. Models that add every small stream and heavy rainfall find far more exposure. A 2018 study in Environmental Research Letters counted 40.8 million people in the contiguous US exposed to a 1-in-100-year river or rainfall flood, against 13.0 million on FEMA’s maps by the same study’s count. A 2022 study in Nature Climate Change placed 41% of the nation’s expected yearly flood losses inside FEMA’s high-risk zone, and the rest outside it. FEMA’s own inspector general reported that by December 2016 only 42% of the stream and coast miles in FEMA’s inventory met its standard for new, valid or updated engineering. In 2009 the National Research Council found that 92% of the continental population had digital flood maps, but only 21% had maps fully meeting FEMA’s quality standards.
Flood insurance decides who recovers
After Hurricane Harvey in 2017, Houston homeowners who were short of credit and flooded outside the floodplain saw bankruptcies rise 20% and severe debt delinquency rise 13% against unflooded blocks. Inside the floodplain, where flood insurance is required on federally backed mortgages, the study found no significant effect. For losses from hurricanes and storm flooding, the Congressional Budget Office estimated that insurance claims cover roughly 85% of losses for insured households, while federal disaster aid covers about 20% for uninsured ones. Coverage rarely lasts. Across the whole program from 2001 to 2009, new policies were typically kept two to four years, and take-up spikes the year after a flood, then steadily declines to where it was.
Home prices are slow to reflect the risk
For river and rain flooding, a review of 37 published studies put the price discount for a home in the 100-year floodplain at 4.6%. On the coast, floodplain homes sold for more, which the authors put down to coastal amenities. A national study of 5.65 million home sales from 1997 to 2017 found a flood-zone discount of about 2%, too small to tell apart from zero, and estimated that homes in flood zones were overvalued by $43.8 billion. Discounts appear after a disaster and then fade. In Pitt County, North Carolina, a flood-zone discount of 6% to 20% after Hurricane Floyd disappeared within five or six years.
Floods harm health long after the water drops
A year after England’s floods of winter 2013 to 2014, 20.1% of people whose homes flooded showed probable depression, against 5.8% in unaffected areas, and 36.2% showed probable post-traumatic stress, against 7.9%, in a survey of about 2,000 households. A review of 35 studies worldwide found death rates rising by up to 50% in the first year after a flood. After Hurricane Katrina, an assessment of New Orleans estimated that 46% of homes, more than 100,000, had some mold contamination.
The water is rising
US coasts now see a median of 5 more high-tide flooding days a year than in 2000, nearly triple, and NOAA projects a national average of 45 to 85 such days a year by 2050. The heaviest rainstorms have grown heavier. From 1958 to 2021, the rain falling on the wettest 1% of days rose 60% in the Northeast, 45% in the Midwest and 37% in the Southeast, according to the Fifth National Climate Assessment.
How to read the flood map
Each place’s page leads with one figure: the share of its residents who live in FEMA’s high-risk zone. That share sits beside the state’s and the nation’s. The US figure is 5.6%, so a place at 11% has about twice the national share, and one at 1% has a fifth of it. The place pages call a share “about the same” as another when it falls between 0.8 and 1.25 times it.
The map colors the yearly chance of a flood, from white for minimal risk to dark blue for 1% a year or more. Light blue marks the 0.2% zone. Hatched or grey ground has no value. Each color is a mean over a cell of about 15,000 square meters, roughly three football fields, so a cell that straddles a zone edge shows a blend.
Two anchors help. A 1% yearly chance is about 1 in 4 over a 30-year mortgage. A 0.2% yearly chance is about 1 in 17. Neither number is the chance for one house: elevation, foundation and drainage change it from lot to lot. For an official determination at an address, lenders and insurers use FEMA’s Flood Insurance Rate Map at the FEMA Flood Map Service Center.
How the map is made, and what it leaves out
What it measures
BestNeighborhood’s flood model reads FEMA’s National Flood Hazard Layer at 10-meter detail and counts residents by 2020 Census block. Where FEMA has studied the ground, the value is FEMA’s: zones A and V read 1% a year, shaded X 0.2%, unshaded X minimal. Each block’s residents are split by the shares of the zones under them, not assigned whole to one zone. The blocks then roll up to every neighborhood, ZIP code, city, county, metro area and state.
Where FEMA’s digital map leaves a gap, the value is an estimate of what FEMA’s map would most likely show there. The estimate learns, from land FEMA did map nearby, how often FEMA drew its 1% and 0.2% zones on ground that the European Commission Joint Research Centre’s river model floods at each return period. It never replaces a zone FEMA drew, and it is not used behind levees, because the river model treats rivers as if no levee stood. Along the Pacific coasts, ground inside the national tsunami design zones reads at least the yearly chance of the design tsunami. Across the 50 states and Washington, DC, the estimate supplies the value for 0.34% of residents; FEMA’s own zones supply the rest.
How it was checked
- Hiding FEMA’s map. FEMA’s zones were hidden in 20 whole counties and the estimate was asked to fill them, each state left out of the data it learned from. On a scale that runs from 0 to 1% a year, it missed FEMA’s own value by 0.31 percentage points, and by 0.24 points along 10 stretches of large river.
- An independent recount. A separate check rebuilt 237 test points and the national tables from the original files, and every value matched. FEMA’s own live map service agreed at all 66 of those points it covers.
- Against the larger counts. Studies that model every small stream and heavy rainfall count far more people at risk, 40.8 million in the contiguous US in one 2018 study, against 13.0 million on FEMA’s maps by that study’s count. This map follows FEMA’s zones, so its 18.4 million sits near FEMA’s end of that range. The quarter of paid claims from outside the zone is one measure of what lies beyond it.
- Against a different measure. FEMA’s National Risk Index counts how often floods have struck each Census tract in the past. Across 79,111 tracts, the map’s values rise with the index’s river-flood frequency, at a rank correlation of 0.35, and with its coastal-flood frequency, at 0.29. The two measure different things, so they agree in direction, not in detail.
What it leaves out
- FEMA’s maps are as old as their panels. Weighted by residents, the median map panel took effect in 2013, and 31% of residents live on panels from before 2010; in New York State it is 74%. A panel can be newer than the study behind it. The Government Accountability Office found that FEMA’s flood maps do not reflect heavy rainfall or the best available climate science. This map shows FEMA’s zones as they stand.
- Rain that floods streets and basements away from rivers and the coast is not counted. The quarter of paid claims from outside the high-risk zone is the clearest measure of what that leaves out.
- The high-risk zone means 1% a year or more. Land right beside a river can flood far more often; the map tops out at 1%.
- Each value is a mean over a small cell of ground, not a reading for one address.
- 4.9% of residents live on ground with no value, where FEMA’s digital flood layer gives no zone and the estimate does not reach. FEMA may hold paper maps there. In Alaska most land has no value.
- The river model sees large rivers only, so the estimate misses small streams where FEMA’s map has a gap.
- Levees can fail or be overtopped. The map rates leveed ground by FEMA’s zone, never as dry.
- Claims count only buildings with federal flood insurance, and insurance counts leave out private flood policies.
Sources
Data sources
- National Flood Hazard Layer, Federal Emergency Management Agency (FEMA). The flood zones on every map, the share of residents in each zone and the dates of the map panels.
- NFIP Redacted Claims, version 3, FEMA, through OpenFEMA, retrieved November 21, 2026. Paid National Flood Insurance Program claims since 1978, with the flood zone each building was rated in.
- NFIP Residential Penetration Rates, version 1, FEMA, through OpenFEMA, retrieved November 21, 2026. Residential buildings with a flood insurance policy, inside and outside the high-risk zone, by county.
- Global River Flood Hazard Maps, European Commission Joint Research Centre. Flood depths behind the estimates where FEMA’s digital flood map does not cover the ground, and river depths on place pages. © European Union, 1995-2026; depths resampled to hexagonal cells.
- National Levee Database, U.S. Army Corps of Engineers. The ground inside levee systems.
- National Storm Surge Risk Maps, NOAA National Hurricane Center. On coastal place pages, the share of residents a hurricane’s storm surge could reach, by category, as community-level awareness. Not an input to the flood zones or the yearly chance.
- 2020 Census Redistricting Data (Public Law 94-171), U.S. Census Bureau. Residents by Census block, so each figure counts people rather than land.
- American Community Survey 5-year estimates, U.S. Census Bureau. Block-group median household income for the income finding above. Not an input to the map.
- National Risk Index, FEMA. Past flood frequencies by Census tract, used to check the map. Not an input to the map.
This product uses the Federal Emergency Management Agency’s OpenFEMA API, but is not endorsed by FEMA. The Federal Government or FEMA cannot vouch for the data or analyses derived from these data after the data have been retrieved from the Agency’s website(s). NOAA, the U.S. Army Corps of Engineers and the Census Bureau do not endorse this map either, and its values are not official flood determinations.
Research
- Federal Emergency Management Agency, FloodSmart. What Is My Flood Risk. floodsmart.gov
- NOAA National Weather Service. Weather Related Fatality and Injury Statistics, 2025. weather.gov
- Ashley, S.T. and Ashley, W.S. (2008). Flood fatalities in the United States. Journal of Applied Meteorology and Climatology 47(3), 805-818. doi:10.1175/2007JAMC1611.1
- NOAA National Centers for Environmental Information. U.S. Billion-Dollar Weather and Climate Disasters, summary statistics 1980-2024. ncei.noaa.gov
- Wing, O.E.J., Bates, P.D., Smith, A.M., et al. (2018). Estimates of present and future flood risk in the conterminous United States. Environmental Research Letters 13(3), 034023. doi:10.1088/1748-9326/aaac65
- Wing, O.E.J., Lehman, W., Bates, P.D., et al. (2022). Inequitable patterns of US flood risk in the Anthropocene. Nature Climate Change 12(2), 156-162. doi:10.1038/s41558-021-01265-6
- U.S. Department of Homeland Security, Office of Inspector General (2017). FEMA Needs to Improve Management of Its Flood Mapping Programs. OIG-17-110. oig.dhs.gov
- National Research Council (2009). Mapping the Zone: Improving Flood Map Accuracy. National Academies Press. doi:10.17226/12573
- U.S. Government Accountability Office (2021). FEMA Flood Maps: Better Planning and Analysis Needed to Address Current and Future Flood Hazards. GAO-22-104079. gao.gov
- Billings, S.B., Gallagher, E.A. and Ricketts, L. (2022). Let the rich be flooded: The distribution of financial aid and distress after Hurricane Harvey. Journal of Financial Economics 146(2), 797-819. doi:10.1016/j.jfineco.2021.11.006
- Congressional Budget Office (2019). Expected Costs of Damage From Hurricane Winds and Storm-Related Flooding. cbo.gov
- Michel-Kerjan, E., Lemoyne de Forges, S. and Kunreuther, H. (2012). Policy tenure under the U.S. National Flood Insurance Program. Risk Analysis 32(4), 644-658. doi:10.1111/j.1539-6924.2011.01671.x
- Gallagher, J. (2014). Learning about an infrequent event: Evidence from flood insurance take-up in the United States. American Economic Journal: Applied Economics 6(3), 206-233. doi:10.1257/app.6.3.206
- Dixon, L., Clancy, N., Seabury, S.A. and Overton, A. (2006). The National Flood Insurance Program’s Market Penetration Rate: Estimates and Policy Implications. RAND Corporation, TR-300-FEMA. rand.org
- Beltrán, A., Maddison, D. and Elliott, R.J.R. (2018). Is flood risk capitalised into property values? Ecological Economics 146, 668-685. doi:10.1016/j.ecolecon.2017.12.015
- Hino, M. and Burke, M. (2021). The effect of information about climate risk on property values. Proceedings of the National Academy of Sciences 118(17), e2003374118. doi:10.1073/pnas.2003374118
- Bin, O. and Landry, C.E. (2013). Changes in implicit flood risk premiums: Empirical evidence from the housing market. Journal of Environmental Economics and Management 65(3), 361-376. doi:10.1016/j.jeem.2012.12.002
- Waite, T.D., Chaintarli, K., Beck, C.R., et al. (2017). The English national cohort study of flooding and health: cross-sectional analysis of mental health outcomes at year one. BMC Public Health 17, 129. doi:10.1186/s12889-016-4000-2
- Alderman, K., Turner, L.R. and Tong, S. (2012). Floods and human health: A systematic review. Environment International 47, 37-47. doi:10.1016/j.envint.2012.06.003
- Brandt, M., Brown, C., Burkhart, J., et al. (2006). Mold prevention strategies and possible health effects in the aftermath of hurricanes and major floods. CDC, MMWR Recommendations and Reports 55(RR-8), 1-27. cdc.gov
- NOAA Center for Operational Oceanographic Products and Services (2025). Annual High Tide Flooding Outlook, 2024-2025. tidesandcurrents.noaa.gov
- Marvel, K., Su, W., Delgado, R., et al. (2023). Chapter 2: Climate trends. Fifth National Climate Assessment, U.S. Global Change Research Program. doi:10.7930/NCA5.2023.CH2; the original site is offline, archived copy
- Holmes, R.R. Jr. and Dinicola, K. (2010). 100-Year flood: it’s all about chance. U.S. Geological Survey General Information Product 106. doi:10.3133/gip106
- U.S. Geological Survey, Water Science School. Floods and Recurrence Intervals. usgs.gov
- Qiang, Y. (2019). Disparities of population exposed to flood hazards in the United States. Journal of Environmental Management 232, 295-304. doi:10.1016/j.jenvman.2018.11.039
- Tate, E., Rahman, M.A., Emrich, C.T. and Sampson, C.C. (2021). Flood exposure and social vulnerability in the United States. Natural Hazards 106(1), 435-457. doi:10.1007/s11069-020-04470-2
Flood maps by state, metro area and county
Every state, county, city, ZIP code and neighborhood has its own page at bestneighborhood.org/flood-map-place/, for example bestneighborhood.org/flood-map-houston-tx/ for the Houston area and bestneighborhood.org/flood-map-77096/ for one Houston ZIP code. The figure beside each place below is the share of its residents in FEMA’s high-risk zone.
Flood maps by state
- Alabama, 4.4%
- Alaska, 2.7%
- Arizona, 3.0%
- Arkansas, 5.8%
- California, 3.3%
- Colorado, 2.3%
- Connecticut, 5.3%
- Delaware, 5.1%
- District of Columbia, 0.5%
- Florida, 24.5%
- Georgia, 4.2%
- Hawaii, 8.2%
- Idaho, 2.1%
- Illinois, 2.7%
- Indiana, 4.0%
- Iowa, 3.8%
- Kansas, 4.1%
- Kentucky, 4.3%
- Louisiana, 21.9%
- Maine, 4.2%
- Maryland, 2.2%
- Massachusetts, 5.8%
- Michigan, 2.8%
- Minnesota, 3.3%
- Mississippi, 11.2%
- Missouri, 2.7%
- Montana, 3.2%
- Nebraska, 4.4%
- Nevada, 2.1%
- New Hampshire, 4.8%
- New Jersey, 6.5%
- New Mexico, 6.2%
- New York, 3.5%
- North Carolina, 3.7%
- North Dakota, 6.7%
- Ohio, 2.9%
- Oklahoma, 4.8%
- Oregon, 3.9%
- Pennsylvania, 2.8%
- Puerto Rico, 10.0%
- Rhode Island, 4.4%
- South Carolina, 6.9%
- South Dakota, 4.1%
- Tennessee, 3.1%
- Texas, 6.2%
- Utah, 1.2%
- Vermont, 3.8%
- Virginia, 4.0%
- Washington, 2.1%
- West Virginia, 6.1%
- Wisconsin, 3.5%
- Wyoming, 2.6%
Each of 98 large metro areas is shown on its principal city’s page.
Metro areas with the largest share in the high-risk zone
- Fort Myers, FL, 37.9%
- Miami, FL, 37.9%
- Baton Rouge, LA, 30.6%
- New Orleans, LA, 30.0%
- Tampa, FL, 23.6%
- Charleston, SC, 22.2%
- Sarasota, FL, 22.2%
- Daytona Beach, FL, 15.7%
- Orlando, FL, 13.8%
- Jacksonville, FL, 13.7%
Metro areas with the smallest share
- Las Vegas, NV, 0.7%
- Spokane, WA, 0.8%
- Ogden, UT, 0.8%
- Salt Lake City, UT, 1.0%
- Provo, UT, 1.0%
- Cleveland, OH, 1.3%
- Los Angeles, CA, 1.4%
- Albany, NY, 1.5%
- Greenville, SC, 1.7%
- Pittsburgh, PA, 1.7%
Counties of 250,000 or more with the largest share
- Collier County, FL, 65.8%
- Miami-Dade County, FL, 47.0%
- Broward County, FL, 42.1%
- Jefferson Parish, LA, 42.0%
- Lee County, FL, 37.9%
- Charleston County, SC, 34.7%
- Galveston County, TX, 30.9%
- Pasco County, FL, 30.9%
- East Baton Rouge Parish, LA, 25.8%
- Pinellas County, FL, 25.4%