
Best Neighborhoods in Suisun City, CA
2026–2027 edition · Data updated July 2026
Every neighborhood in and around Suisun City, scored on 40 measures of daily life and ranked to fit what matters to you. The coast is close, and the measures below put a number on how close. To work out which city fits you best, start with the best places to live tool.
Suisun City ranks 1,566th of 2,098 U.S. small cities on the BestNeighborhood index. It scores best on the weather, and crime is the weak spot.
Show off this ranking with the free Best Places to Live badge for your site.
Map of the best neighborhoods in Suisun City
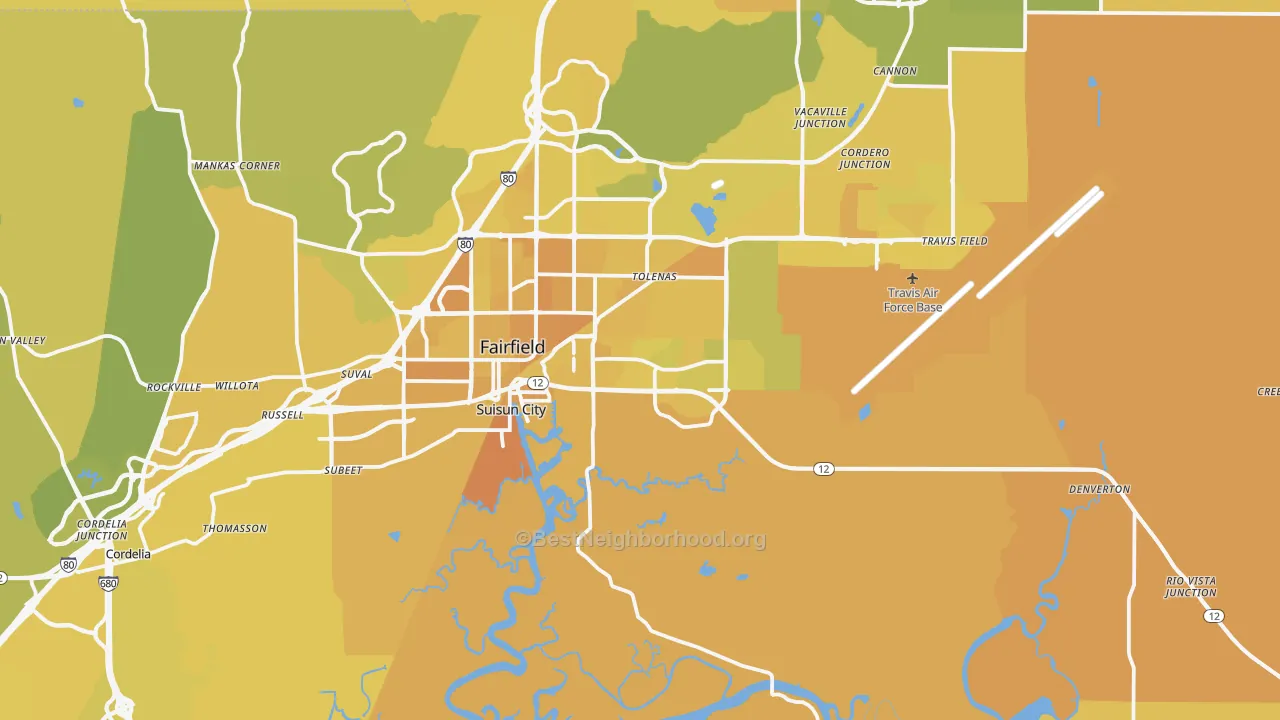
BestNeighborhood is the only ranking that scores 40 measures of daily life neighborhood by neighborhood and lets you re-weight every one of them yourself.
Suisun City's strengths and weaknesses
Where Suisun City ranks high
- Nice weatherabout 163 pleasant days a year, better than 86% of small cities
- Air qualityBetter than 88% of small cities
- Low vacancyBetter than 97% of small cities
- WalkabilityBetter than 71% of small cities
- BikingBetter than 83% of small cities
Where Suisun City ranks low
- Crime safetyBetter than only 16% of small cities
- School gradeC−, better than only 18% of small cities
- Short commute31.9 minutes each way, better than only 15% of small cities
- Local economyBetter than only 13% of small cities
- Disaster safetyBetter than only 20% of small cities
What it costs to buy a home in Suisun City
A household needs to earn about $147,000 a year to comfortably buy the median Suisun City home, at 20% down and today's 30-year rate. That runs well above the area's median income of $101,688, so buying stretches a typical household.
Where the monthly payment goes
Assumes a 20% down payment, a 6.7% 30-year fixed rate, and a 28% share of income going to the payment. The rate is the 2026-08-20 30-year fixed average, series MORTGAGE30US from the St. Louis Fed, which publishes Freddie Mac's weekly survey. Against the median home value, property tax uses Suisun City's effective rate of 0.75%, and insurance is estimated at 0.4% of home value a year.
Renting versus buying
At today's prices, buying tends to cost more than renting for about the first 9 years, then pulls ahead as rent keeps rising and the mortgage builds equity. The chart tracks the running cost of each.
Who lives in Suisun City
Suisun City runs younger than the country, and households here run larger than average.
Residents by age
Racial and ethnic makeup has its own map. See the race and diversity map for Suisun City.
Who works in Suisun City, and how
Work in Suisun City centers on health care & social and retail trade. Unemployment sits above the national rate, and jobs are growing.
Largest industries
How people get to work
- Drive or carpool 89%
- Work from home 8%
- Transit, walk, or bike 3%
Life in Suisun City
Suisun City has more parkland per resident than 81% of small cities. The coast is about 46 minutes away. That concentrates in some parts of Suisun City and thins out in others, which the map shows.
What the weather is like in Suisun City, month by month
Suisun City sees roughly 163 pleasant days a year. July highs average about 93 degrees. January highs sit near 61, with lows near 38. The comfortable stretch runs April through October.
Show the monthly temperatures
| Month | Avg high | Avg | Avg low |
|---|---|---|---|
| January | 61° | 48° | 38° |
| April | 75° | 59° | 45° |
| July | 93° | 72° | 57° |
| October | 83° | 64° | 48° |
Flying in and out of Suisun City
Sacramento International sits about 38 miles away. It is a medium hub and boarded 6.8 million passengers in 2025, with 85 nonstop destinations.
The best schools in and around Suisun City
Schools across Suisun City average a C−, better than 18% of small cities.
Top elementary schools
- Nelda Mundy ElementaryA · 63% proficient
- Cordelia Hills ElementaryB+ · 54% proficient
- Suisun Valley ElementaryB+ · 49% proficient
Top middle schools
- Green Valley MiddleA− · 56% proficient
- Benicia MiddleB+ · 46% proficient
- Riverview MiddleC · 30% proficient
Top high schools
- Angelo Rodriguez HighA− · 50% proficient
- Benicia HighB+ · 46% proficient
- Pittsburg Senior HighC · 27% proficient
Grades come from K-12 test scores, with scores projected for schools missing data. See every Suisun City school and its grade on SchoolGrade.
Suisun City measure by measure
Cards are ordered by how much each measure matters to you, so the ones you weighted highest come first. Expand to see every measure. Percentages compare Suisun City against the other 2,097 small cities.
Who Suisun City suits
Common questions about living in Suisun City
Is Suisun City a good place to live?
Using BestNeighborhood's default rankings, Suisun City ranks 1,566th of 2,098 small cities. It scores highest on the weather, clean air, and few empty homes, and lowest on crime and the schools. How good it is for you depends on which of those you weight most, which the map lets you set.
Is Suisun City expensive to live in?
The median home is worth $563,519. The overall cost of living runs about 22% above the national average. Set against a $101,688 median income, cost of living beats 29% of small cities.
Is Suisun City safe?
Suisun City is safer than 16% of small cities. Safety varies a lot by neighborhood. Crime costs an estimated $487 per resident a year.
What is the weather like in Suisun City?
July highs average about 93 degrees, and January highs near 61 with lows near 38. That works out to about 163 pleasant days a year, more than 86% of small cities.
Is Suisun City good for families?
Schools beat 18% of small cities, crime safety beats 16%, and childcare runs $1,461 a month.
Compare Suisun City with other small cities
Sources and methodology
Every measure on this page is scored for each neighborhood, then rolled up to Suisun City. Scores are absolute rather than ranked, which means a 60 in Suisun City represents the same real quantity as a 60 anywhere else, and the ranking is a weighted average of those absolutes. The map colors come from a national scale calibrated against a population weighted random sample of 5,000 neighborhoods. That absolute scoring is what no other places-to-live ranking does: it puts a single neighborhood, a town, a metro, and a state on one scale, so the same 40 measures answer both which metro to move to and which street inside it to buy on. Read the full methodology.
Suisun City detail on BestNeighborhood maps:
- Walk Grade for Suisun City: walkability, transit, and biking, measured on the real street network rather than by straight line distance.
- Noise in Suisun City: road, rail, and aviation sound modeling calibrated against federal ground truth measurements.
- Conservative vs liberal map of Suisun City: precinct level election results apportioned to neighborhoods.
- Mobile and cell coverage in Suisun City: carrier by carrier coverage behind the cell score.
Suisun City detail on related sites:
- CrimeGrade: neighborhood crime rates behind the crime safety score.
- ISPreports.org: provider by provider internet availability and advertised speeds.
- CoverageWatch: the car insurance premiums behind the cheap car insurance score.
Federal and public data:
- U.S. Census Bureau American Community Survey: income, home value, rent, vacancy, commute time and mode, educational attainment, home age, age structure, household type, industry, and race.
- NOAA Global Surface Summary of the Day: the daily station record behind the monthly temperatures and the pleasant-day count.
- FAA Passenger Boarding Data: airport size and annual passenger counts.
- Freddie Mac Primary Mortgage Market Survey: the 30-year fixed rate used in the cost-to-buy estimate.
- FBI Crime Data Explorer: reported offenses behind the tangible crime cost estimate.
- U.S. EPA Air Quality System: five year average air quality index.
- FEMA National Risk Index: expected annual loss from natural hazards.
- CDC PLACES: disease burden, preventable risk, and barriers to care.
- National Center for Education Statistics: school enrollment and assessment inputs behind the school grade.
- FCC National Broadband Map: internet and wireless availability.
- U.S. Bureau of Labor Statistics: employment and job growth behind the local economy score.
- Religious activity uses a proprietary religious signal measurement.
Your priorities
Move a slider to say how much a measure matters. Zero turns it off.