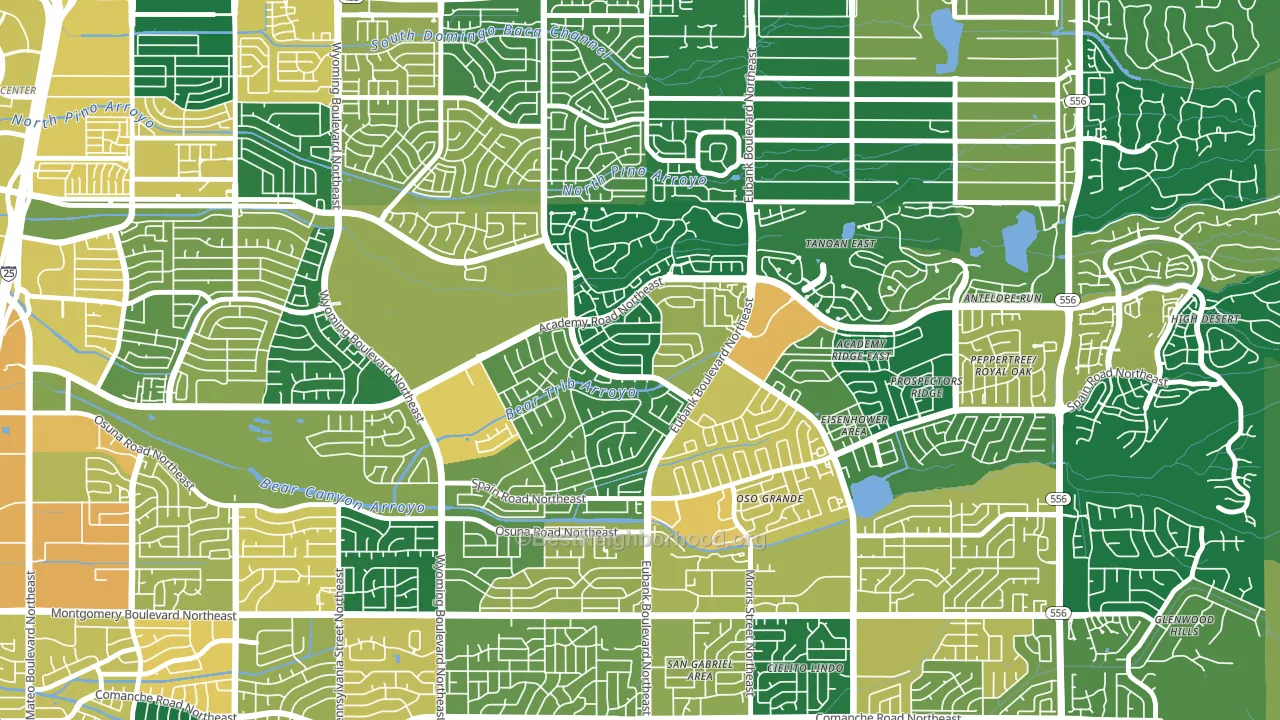
Academy Hills Park leans slightly Democratic by roughly 14 points: about 57% of voters vote Democratic and 43% Republican.
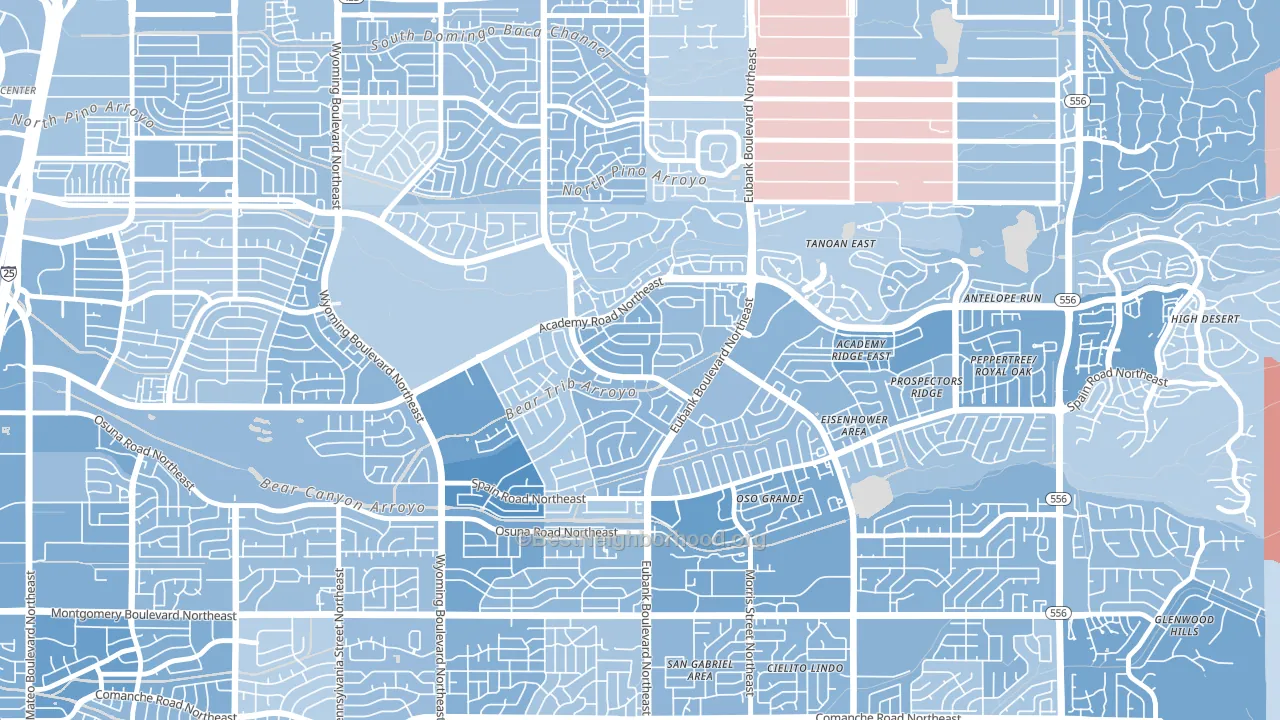
About 84% of adults in Academy Hills Park typically vote, above the U.S. average of about 62%. Among adults in Academy Hills Park, ~48% vote Democratic, ~36% Republican, and ~16% don't vote. The map below shows estimated turnout by block group.
How Academy Hills Park compares
Among neighborhoods within 5 miles, Academy Hills Park leans more Democratic than 3 of 14 neighbors.
Academy Hills Park runs about 7 points more Democratic than New Mexico as a whole.
Politics vary noticeably by block within Academy Hills Park. The east side is the most Democratic-leaning (D+21) and the southwest side is the least Democratic-leaning (D+7), a spread of about 14 points.
Why Academy Hills Park leans the way it does
This analysis examined 14,881 data points per neighborhood to find what predicts political lean and turnout. The items below are a few correlations that stood out for Academy Hills Park, not a ranked or complete list of what matters most.
Areas with high college attainment vote Democratic. About 59% of adults in Academy Hills Park hold a bachelor's degree, about 30 points above the U.S. average of 28%.
Cancer-screening access and voter turnout
Places with high colon-cancer-screening access tend to turn out at a higher rate; Academy Hills Park, Albuquerque, NM sits in the top quarter nationally on this measure. Cancer screening does not drive turnout; it reflects income, insurance, and healthcare access.
Why turnout in Academy Hills Park looks the way it does
Areas with strong routine healthcare access turn out at higher rates. Academy Hills Park is in the top quarter nationally for routine-care measures such as insurance coverage, preventive screenings, and dental visits. The dental-visit rate here is about 75%, about 15 points above the U.S. average of 60%. High high-school completion lines up with higher turnout, and more than 99% of adults in Academy Hills Park have completed high school, above 92% of neighborhoods. Learn more about the findings and methodology on the political spectrum map.
Nearby Neighborhoods
- Heritage East, Albuquerque, NM D+13
- North Wyoming, Albuquerque, NM D+14
- N Albuquerque Acres, Albuquerque, NM Even
- Academy Acres North, Albuquerque, NM D+16
- Del Norte, Albuquerque, NM D+28
- Nor Este, Albuquerque, NM D+8
- Uptown, Albuquerque, NM D+30
- Hodgin, Albuquerque, NM D+30
- McKinley, Albuquerque, NM D+23
- Princess Jeanne, Albuquerque, NM D+17
Neighborhoods with Similar Populations
- Caprock, Lubbock, TX R+18
- Historic Montford, Asheville, NC D+72
- Capitol Park, Des Moines, IA D+33
- Rancho Dominguez, Compton, CA D+39
- Emerald Lake-Miami, Lake Worth, FL D+30
- Heart of the City, Beaumont, TX D+53
- Stetson Hills, Colorado Springs, CO R+11
- Oakland Beach, Warwick, RI D+5
- East Congress, Austin, TX D+50
- North Park Forest, Houston, TX D+46
Sources and methodology
Precinct-level voting records used to fit the model come from New Mexico Secretary of State, Bureau of Elections, distributed by the Voting and Election Science Team. Demographic inputs come from the U.S. Census Bureau (ACS 5-year estimates and the 2020 Decennial Census). Health and environmental inputs come from the CDC (PLACES and the Environmental Justice Index). Land cover comes from the USGS and EPA. Election-day and lead-up weather come from PRISM 4km daily grids and the NOAA Global Historical Climatology Network. Mail-voting and election-administration patterns come from the MIT Election Lab's Survey of the Performance of American Elections. Block-group crime detail comes from CrimeGrade. Internet data and modeling support provided by ISPreports.org.
Modeling and analysis by the BestNeighborhood data science team. Full methodology and findings: political spectrum map.
Methodology reviewed by the BestNeighborhood data team. Last updated May 2026.