Rancho Dominguez leans heavily Democratic by roughly 40 points: about 70% of voters vote Democratic and 30% Republican.
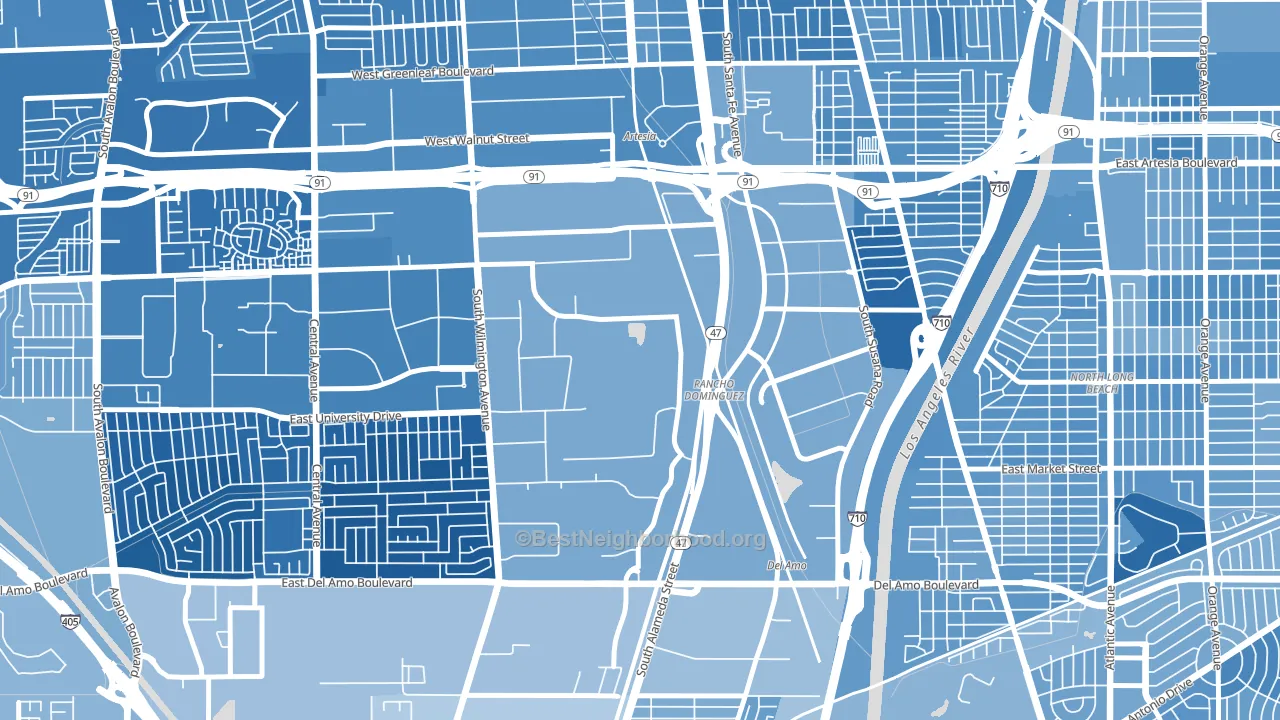
About 48% of adults in Rancho Dominguez typically vote, below the U.S. average of about 62%. Among adults in Rancho Dominguez, ~34% vote Democratic, ~14% Republican, and ~52% don't vote. The map below shows estimated turnout by block group.
How Rancho Dominguez compares
Among neighborhoods within 5 miles, Rancho Dominguez leans more Democratic than 4 of 10 neighbors.
Rancho Dominguez runs about 19 points more Democratic than California as a whole.
Why Rancho Dominguez leans the way it does
This analysis examined 14,881 data points per neighborhood to find what predicts political lean and turnout. The items below are a few correlations that stood out for Rancho Dominguez, not a ranked or complete list of what matters most.
Dense areas vote Democratic. More than 99% of residents in Rancho Dominguez live in densely developed areas, about 64 points above the U.S. average of 36%.
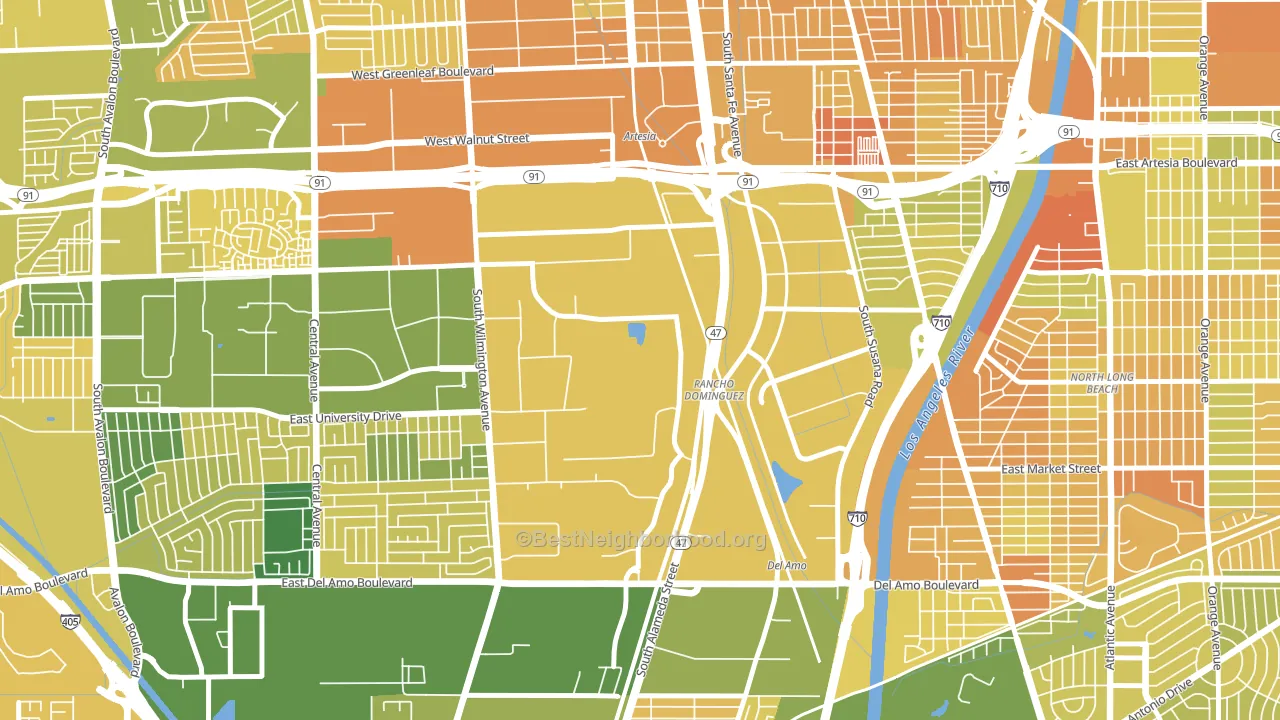
High-school completion, developed land, and voter turnout
Places that combine low high-school-completion share and a heavily developed built environment tend to turn out at a lower rate, as Rancho Dominguez, Compton, CA does.
Why turnout in Rancho Dominguez looks the way it does
Turnout in Rancho Dominguez sits close to the national pattern. Routine healthcare access, homeownership, education, and food security all land near their national averages here. Learn more about the findings and methodology on the political spectrum map.
Nearby Neighborhoods
- North West Long Beach, Long Beach, CA D+49
- North Long Beach, Long Beach, CA D+39
- Los Cerritos, Long Beach, CA D+40
- Bixby Knolls, Long Beach, CA D+46
- Bixby Area, Long Beach, CA D+37
- West Rancho Domingues, Compton, CA D+61
- Californial Heights, Long Beach, CA D+46
- West Side, Long Beach, CA D+34
- Harbor Gateway, Torrance, CA D+35
- Wrigley, Long Beach, CA D+42
Neighborhoods with Similar Populations
- Capitol Park, Des Moines, IA D+33
- Emerald Lake-Miami, Lake Worth, FL D+30
- Academy Hills Park, Albuquerque, NM D+13
- Historic Montford, Asheville, NC D+72
- Oakland Beach, Warwick, RI D+5
- Caprock, Lubbock, TX R+18
- Columbia San Diego, San Diego, CA D+37
- Fairview, Charlotte, NC R+60
- Scenic Bluff, Fort Worth, TX D+21
- Burrage, Hanson, MA Even
Sources and methodology
Precinct-level voting records used to fit the model come from California Secretary of State, Elections, distributed by the Voting and Election Science Team. Demographic inputs come from the U.S. Census Bureau (ACS 5-year estimates and the 2020 Decennial Census). Health and environmental inputs come from the CDC (PLACES and the Environmental Justice Index). Land cover comes from the USGS and EPA. Election-day and lead-up weather come from PRISM 4km daily grids and the NOAA Global Historical Climatology Network. Mail-voting and election-administration patterns come from the MIT Election Lab's Survey of the Performance of American Elections. Block-group crime detail comes from CrimeGrade. Internet data and modeling support provided by ISPreports.org.
Modeling and analysis by the BestNeighborhood data science team. Full methodology and findings: political spectrum map.
Methodology reviewed by the BestNeighborhood data team. Last updated May 2026.