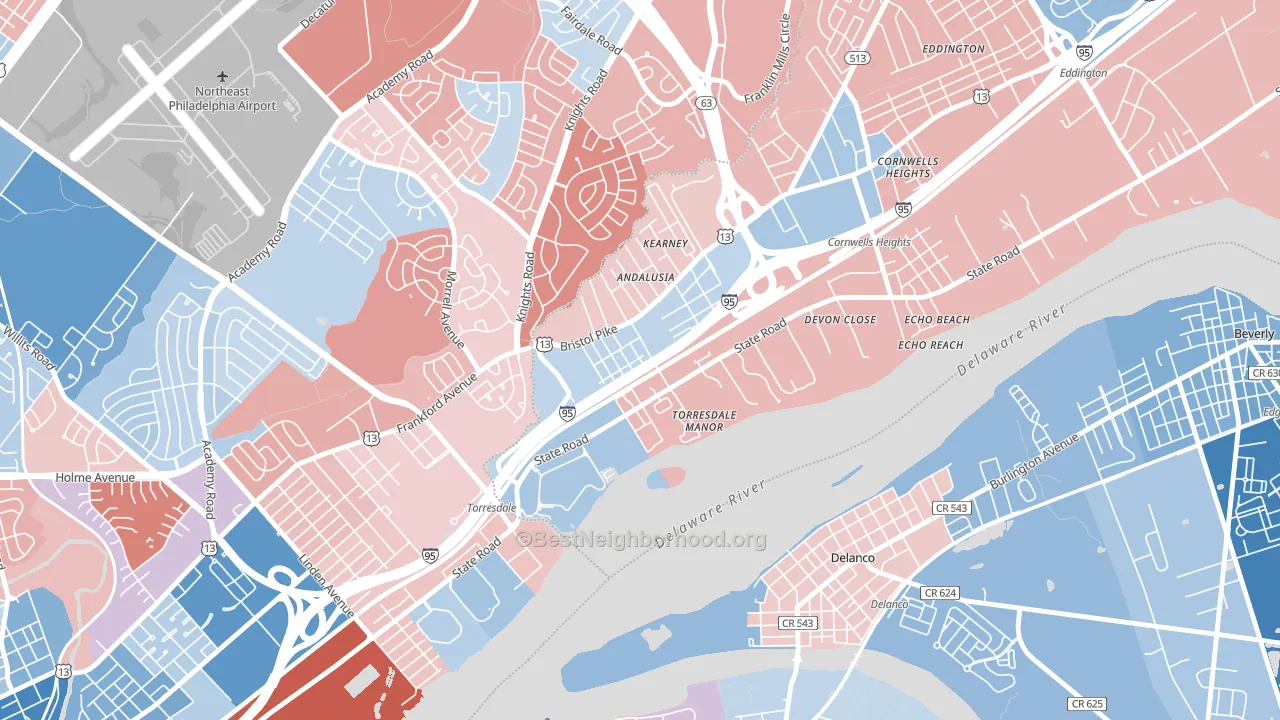
Andalusia leans slightly Democratic by roughly 6 points: about 53% of voters vote Democratic and 47% Republican.
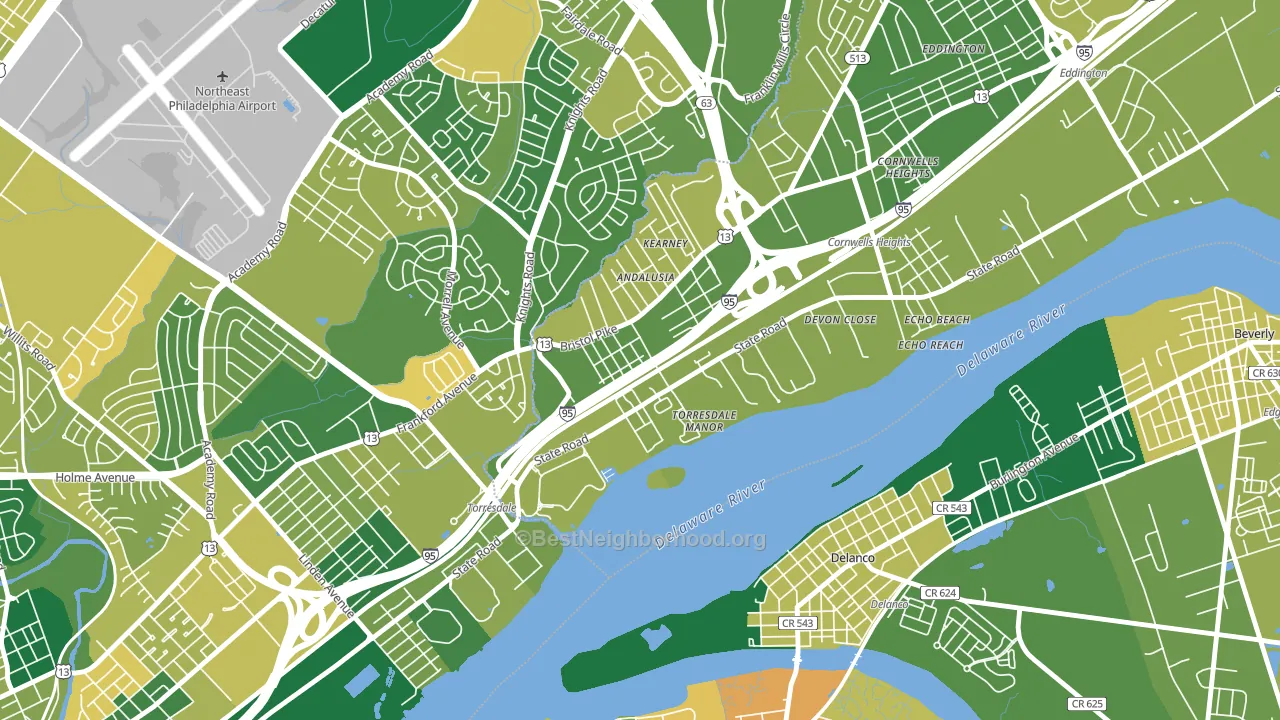
About 75% of adults in Andalusia typically vote, above the U.S. average of about 62%. Among adults in Andalusia, ~40% vote Democratic, ~35% Republican, and ~25% don't vote. The map below shows estimated turnout by block group.
How Andalusia compares
Among neighborhoods within 5 miles, Andalusia leans more Democratic than 4 of 12 neighbors.
Andalusia runs about 8 points more Democratic than Pennsylvania as a whole.
Politics vary noticeably by block within Andalusia. The southwest side runs the most Democratic (D+16) and the northeast side runs the most Republican (R+5), a spread of about 21 points.
Why Andalusia leans the way it does
Density, race composition, education, and family structure all sit close to their national averages in Andalusia. The lean here lands roughly where demographic data alone would predict.
Developed land, local retail density, and voter turnout
Places that combine a rural land-use pattern and dense local retail within a mile tend to turn out at a higher rate, as Andalusia, Bensalem, PA does.
Why turnout in Andalusia looks the way it does
Turnout in Andalusia sits close to the national pattern. Routine healthcare access, homeownership, education, and food security all land near their national averages here. Learn more about the findings and methodology on the political spectrum map.
Nearby Neighborhoods
- Torresdale, Philadelphia, PA R+10
- Academy Gardens, Philadelphia, PA D+7
- Byberry, Philadelphia, PA R+12
- Stanwood, Bensalem, PA D+14
- Holmesburg, Philadelphia, PA D+22
- Bustleton, Philadelphia, PA R+3
- Millside Heights, Riverside, NJ D+9
- Somerset Park, Willingboro, NJ D+65
- Rhawnhurst, Philadelphia, PA D+8
- Somerton, Philadelphia, PA R+15
Neighborhoods with Similar Populations
- Duclay Forest, Jacksonville, FL D+32
- Midway Place, Bryan, TX D+31
- Point Richmond, Richmond, CA D+66
- Highland Park, Aurora, CO D+36
- East Deering, Portland, ME D+66
- White Caps, Kenosha, WI D+4
- Historic Uptown, St. Petersburg, FL D+34
- Holly, Austin, TX D+62
- Town of Blake, South Daytona, FL R+13
- South Houston Gardens, Pasadena, TX R+20
Sources and methodology
Precinct-level voting records used to fit the model come from Pennsylvania Department of State, Bureau of Elections, distributed by the Voting and Election Science Team. Demographic inputs come from the U.S. Census Bureau (ACS 5-year estimates and the 2020 Decennial Census). Health and environmental inputs come from the CDC (PLACES and the Environmental Justice Index). Land cover comes from the USGS and EPA. Election-day and lead-up weather come from PRISM 4km daily grids and the NOAA Global Historical Climatology Network. Mail-voting and election-administration patterns come from the MIT Election Lab's Survey of the Performance of American Elections. Block-group crime detail comes from CrimeGrade. Internet data and modeling support provided by ISPreports.org.
Modeling and analysis by the BestNeighborhood data science team. Full methodology and findings: political spectrum map.
Methodology reviewed by the BestNeighborhood data team. Last updated May 2026.