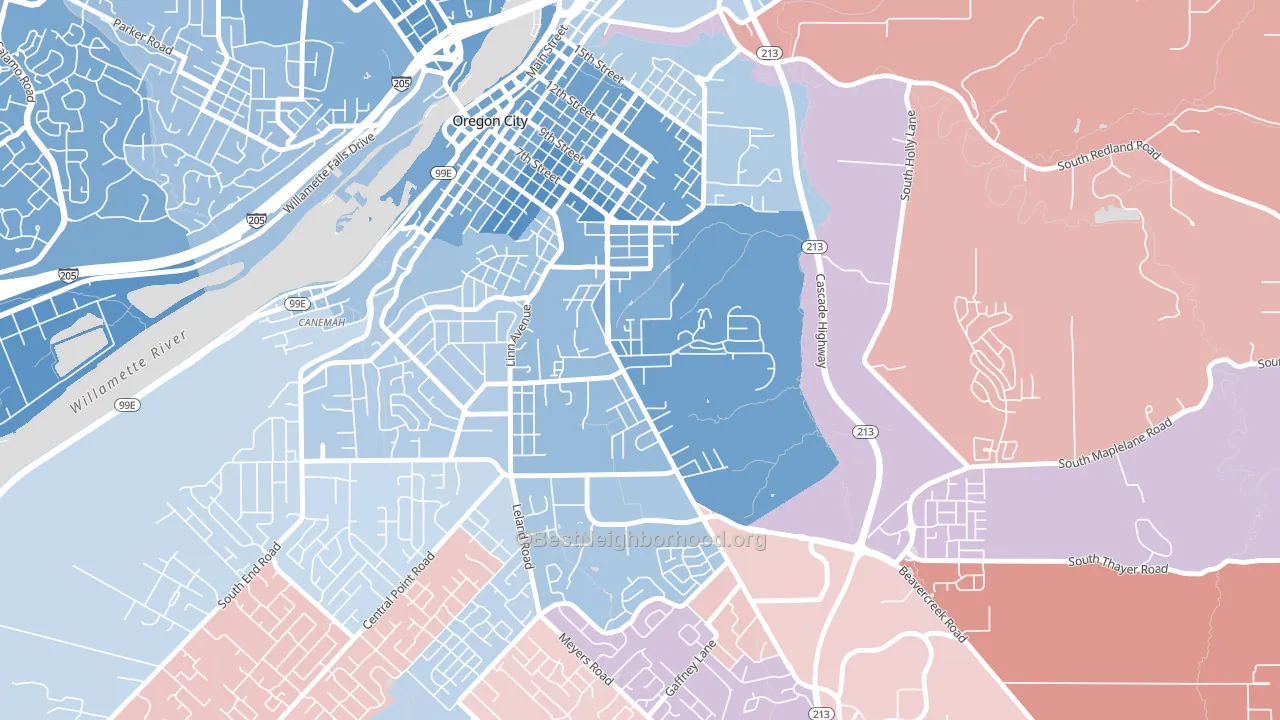
Barclay Hills leans Democratic by roughly 22 points: about 61% of voters vote Democratic and 39% Republican.
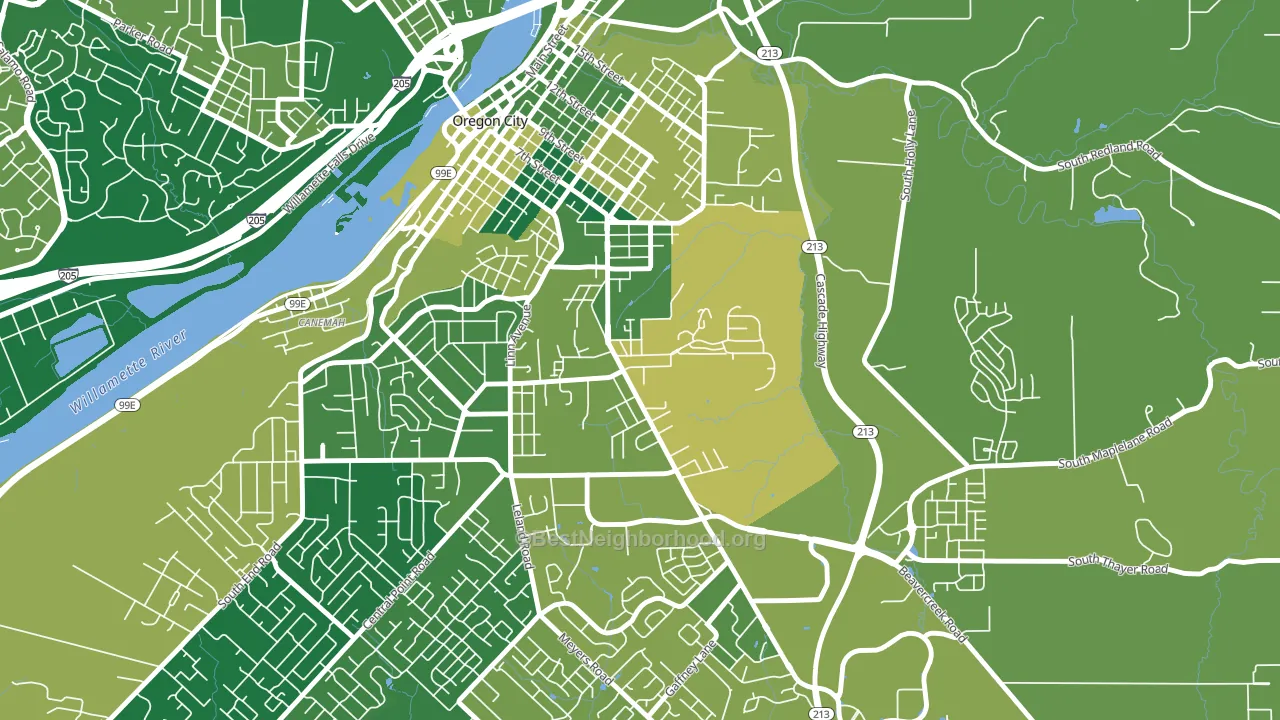
About 70% of adults in Barclay Hills typically vote, above the U.S. average of about 62%. Among adults in Barclay Hills, ~43% vote Democratic, ~27% Republican, and ~30% don't vote. The map below shows estimated turnout by block group.
How Barclay Hills compares
Among neighborhoods within 5 miles, Barclay Hills leans more Democratic than 5 of 8 neighbors.
Barclay Hills runs about 8 points more Democratic than Oregon as a whole.
Why Barclay Hills leans the way it does
Density, race composition, education, and family structure all sit close to their national averages in Barclay Hills. The lean here lands roughly where demographic data alone would predict.
Developed land, local retail density, and voter turnout
Places that combine a rural land-use pattern and dense local retail within a mile tend to turn out at a higher rate, as Barclay Hills, Oregon City, OR does.
Why turnout in Barclay Hills looks the way it does
Turnout in Barclay Hills sits close to the national pattern. Learn more about the findings and methodology on the political spectrum map.
Nearby Neighborhoods
- McLoughlin, Oregon City, OR D+33
- Hillendale, Oregon City, OR Even
- Gaffney Lane, Oregon City, OR R+4
- Caufield, Oregon City, OR R+3
- Willamette-West Linn, West Linn, OR D+31
- Jennings Lodge, Portland, OR D+22
- Hidden Springs, West Linn, OR D+39
- North Clackamas, Oatfield, OR D+13
- Stafford-Tualatin Valley, West Linn, OR D+21
- Palisades, Lake Oswego, OR D+39
Neighborhoods with Similar Populations
- Alderman Park, Jacksonville, FL D+14
- Ellis Lake, Concord, CA D+42
- Ocean Avenue, Portland, ME D+77
- Browncroft, Rochester, NY D+47
- Galindo, Austin, TX D+54
- Venerable Flackville, Indianapolis, IN D+70
- Tam O'shanter, Bellevue, WA D+44
- Abbot, Ann Arbor, MI D+60
- Esprit, St. Cloud, FL R+14
- Woodbridge at Monte Viejo, San Antonio, TX D+9
Sources and methodology
Precinct-level voting records used to fit the model come from Oregon Secretary of State, Elections Division, distributed by the Voting and Election Science Team. Demographic inputs come from the U.S. Census Bureau (ACS 5-year estimates and the 2020 Decennial Census). Health and environmental inputs come from the CDC (PLACES and the Environmental Justice Index). Land cover comes from the USGS and EPA. Election-day and lead-up weather come from PRISM 4km daily grids and the NOAA Global Historical Climatology Network. Mail-voting and election-administration patterns come from the MIT Election Lab's Survey of the Performance of American Elections. Block-group crime detail comes from CrimeGrade. Internet data and modeling support provided by ISPreports.org.
Modeling and analysis by the BestNeighborhood data science team. Full methodology and findings: political spectrum map.
Methodology reviewed by the BestNeighborhood data team. Last updated May 2026.