Barnaby Woods is a Democratic stronghold. About 87% of voters here vote Democratic and 13% Republican.
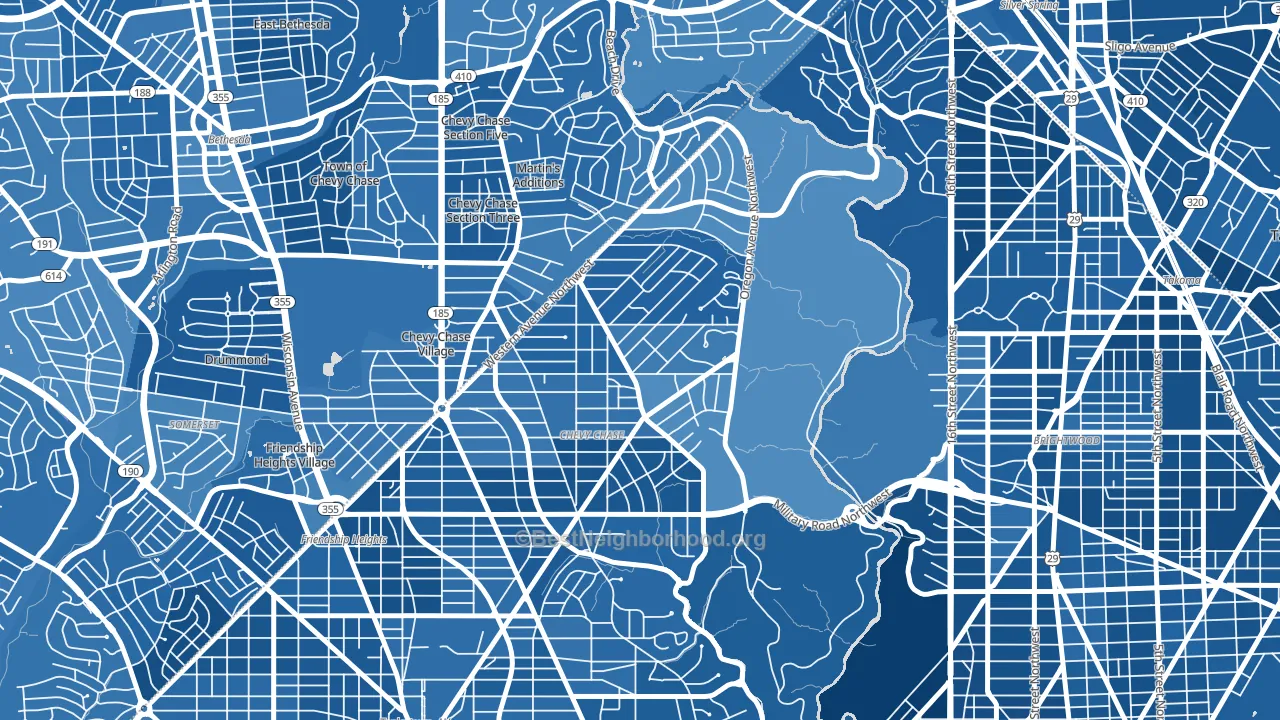
About 97% of adults in Barnaby Woods typically vote, above the U.S. average of about 62%. Among adults in Barnaby Woods, ~85% vote Democratic, ~13% Republican, and ~2% don't vote. The map below shows estimated turnout by block group.
How Barnaby Woods compares
Among neighborhoods within 5 miles, Barnaby Woods leans more Democratic than 7 of 29 neighbors.
Barnaby Woods runs about 9 points more Republican than the District of Columbia as a whole.
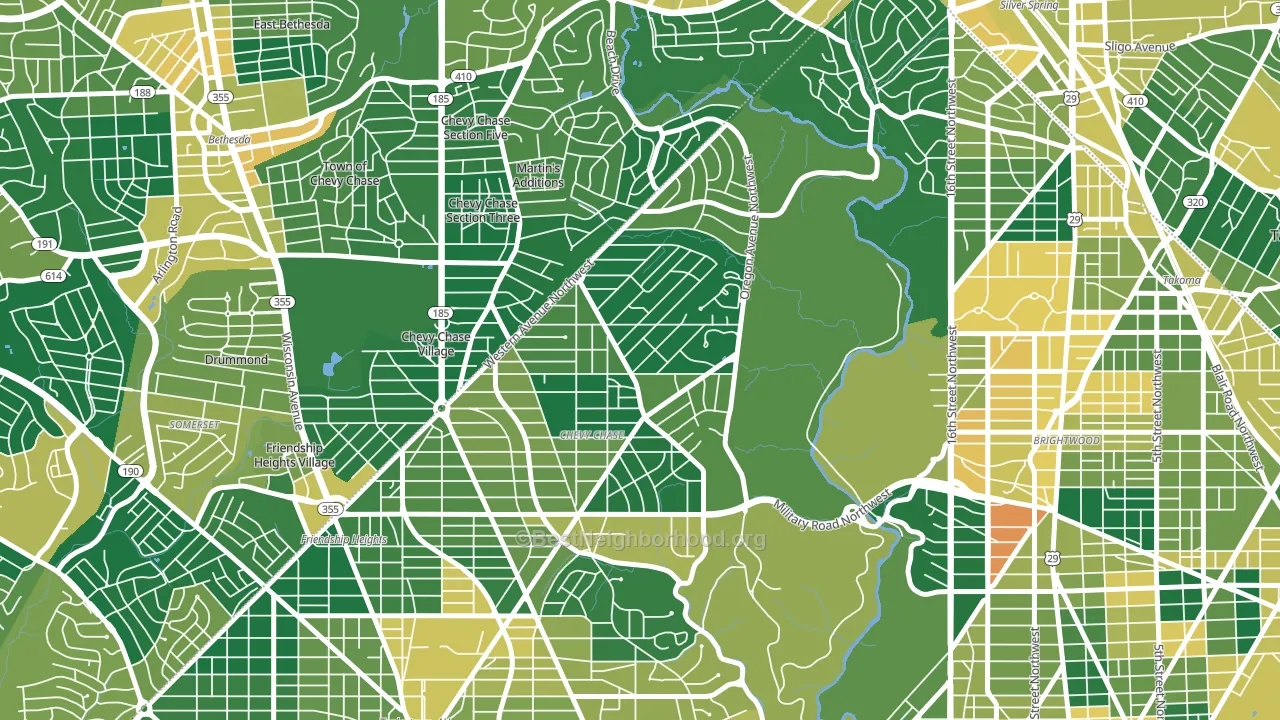
Politics vary noticeably by block within Barnaby Woods. The southeast side is the most Democratic-leaning (D+83) and the west side is the least Democratic-leaning (D+65), a spread of about 18 points.
Why Barnaby Woods leans the way it does
This analysis examined 14,881 data points per neighborhood to find what predicts political lean and turnout. The items below are a few correlations that stood out for Barnaby Woods, not a ranked or complete list of what matters most.
Areas with high college attainment vote Democratic. About 85% of adults in Barnaby Woods hold a bachelor's degree, about 57 points above the U.S. average of 28%.
Population density and Democratic lean
Places with high population density tend to lean Democratic; Barnaby Woods, Washington, DC sits in the top quarter nationally on this measure.
Why turnout in Barnaby Woods looks the way it does
Areas with strong routine healthcare access turn out at higher rates. Barnaby Woods is in the top quarter nationally for routine-care measures such as insurance coverage, preventive screenings, and dental visits. The dental-visit rate here is about 82%, about 22 points above the U.S. average of 60%. Homeowners vote more often than renters, and about 89% of households in Barnaby Woods own their home, compared to around 57% in nearby neighborhoods. Learn more about the findings and methodology on the political spectrum map.
Nearby Neighborhoods
- Chevy Chase, Washington, DC D+79
- Takoma Park, Washington, DC D+84
- Brightwood, Washington, DC D+77
- Cleveland Park, Washington, DC D+77
- Fort Totten-Upper Northeast, Washington, DC D+83
- Au-Tenleytown, Washington, DC D+66
- Petworth, Washington, DC D+86
- Mount Pleasant, Washington, DC D+83
- Woodley Park, Washington, DC D+80
- Carroll Manor, Takoma Park, MD D+84
Neighborhoods with Similar Populations
- Lincoln Park, Washington, DC D+84
- Panther Creek, The Woodlands, TX R+22
- Hill East, Washington, DC D+80
- Northeast Hazel Dell, Hazel Dell, WA D+18
- Oak Forest, Little Rock, AR D+81
- Crossroads, Highland, CA R+5
- Ardenwood, Fremont, CA D+36
- Madison Heights, Pasadena, CA D+65
- Fairview, Anchorage, AK D+32
- South San Pedro, Albuquerque, NM D+30
Sources and methodology
Precinct-level voting records used to fit the model come from District of Columbia Board of Elections, distributed by the Voting and Election Science Team. Demographic inputs come from the U.S. Census Bureau (ACS 5-year estimates and the 2020 Decennial Census). Health and environmental inputs come from the CDC (PLACES and the Environmental Justice Index). Land cover comes from the USGS and EPA. Election-day and lead-up weather come from PRISM 4km daily grids and the NOAA Global Historical Climatology Network. Mail-voting and election-administration patterns come from the MIT Election Lab's Survey of the Performance of American Elections. Block-group crime detail comes from CrimeGrade. Internet data and modeling support provided by ISPreports.org.
Modeling and analysis by the BestNeighborhood data science team. Full methodology and findings: political spectrum map.
Methodology reviewed by the BestNeighborhood data team. Last updated May 2026.