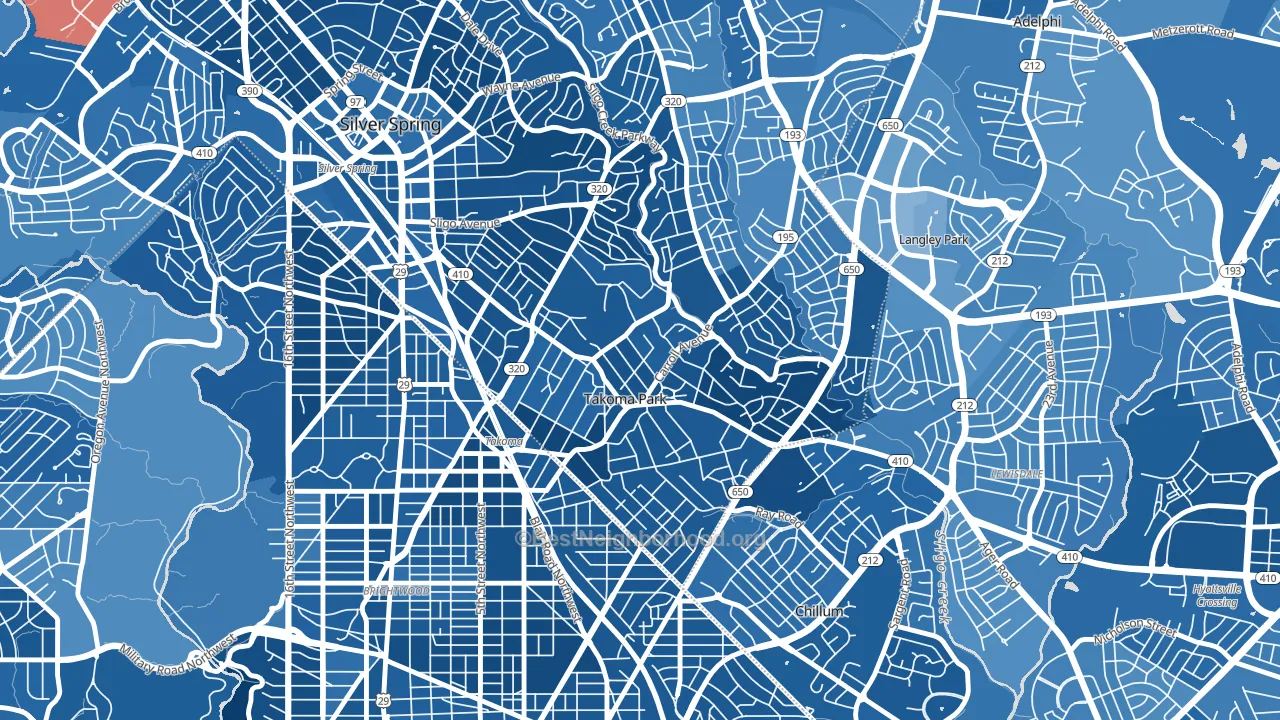
Carroll Manor is a Democratic stronghold. About 92% of voters here vote Democratic and 8% Republican.
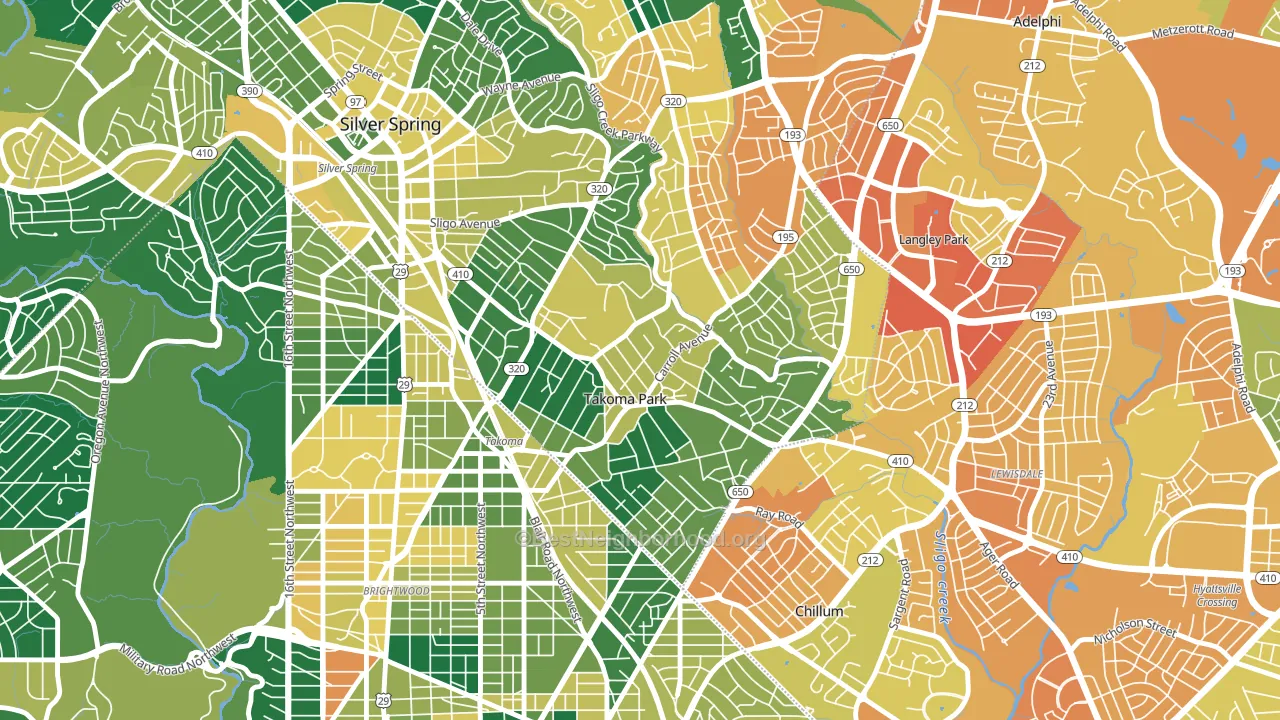
About 70% of adults in Carroll Manor typically vote, above the U.S. average of about 62%. Among adults in Carroll Manor, ~65% vote Democratic, ~5% Republican, and ~30% don't vote. The map below shows estimated turnout by block group.
How Carroll Manor compares
Among neighborhoods within 5 miles, Carroll Manor leans more Democratic than 18 of 24 neighbors.
Carroll Manor runs about 55 points more Democratic than Maryland as a whole.
Politics vary noticeably by block within Carroll Manor. The east side is the most Democratic-leaning (D+90) and the west side is the least Democratic-leaning (D+75), a spread of about 15 points.
Why Carroll Manor leans the way it does
This analysis examined 14,881 data points per neighborhood to find what predicts political lean and turnout. The items below are a few correlations that stood out for Carroll Manor, not a ranked or complete list of what matters most.
Areas with high college attainment vote Democratic. About 60% of adults in Carroll Manor hold a bachelor's degree, about 32 points above the U.S. average of 28%.
Population density, never-married share, and Democratic lean
Places that combine high population density and a low never-married share tend to lean Democratic, as Carroll Manor, Takoma Park, MD does.
Why turnout in Carroll Manor looks the way it does
Turnout in Carroll Manor sits close to the national pattern. Routine healthcare access, homeownership, education, and food security all land near their national averages here. Learn more about the findings and methodology on the political spectrum map.
Nearby Neighborhoods
- New Hampshire Gardens, Takoma Park, MD D+78
- Fort Totten-Upper Northeast, Washington, DC D+83
- Langley Park, Hyattsville, MD D+41
- Takoma Park, Washington, DC D+84
- Green Meadows, Chillum, MD D+53
- Brightwood, Washington, DC D+77
- Michigan Park, Washington, DC D+86
- Catholic University-Brookland, Washington, DC D+81
- Petworth, Washington, DC D+86
- Barnaby Woods, Washington, DC D+74
Neighborhoods with Similar Populations
- Twin Lakes, Denver, CO D+27
- Old Town, Alexandria, VA D+54
- Highview, Louisville, KY D+4
- Shiloh, York, PA R+12
- Dimond, Oakland, CA D+67
- Kirkman North, Orlando, FL D+53
- Fruitridge Manor, Sacramento, CA D+31
- Hopkins-Middle East, Baltimore, MD D+80
- Lyon Street, Santa Ana, CA D+31
- Quintana Community, San Antonio, TX D+35
Sources and methodology
Precinct-level voting records used to fit the model come from Maryland State Board of Elections, distributed by the Voting and Election Science Team. Demographic inputs come from the U.S. Census Bureau (ACS 5-year estimates and the 2020 Decennial Census). Health and environmental inputs come from the CDC (PLACES and the Environmental Justice Index). Land cover comes from the USGS and EPA. Election-day and lead-up weather come from PRISM 4km daily grids and the NOAA Global Historical Climatology Network. Mail-voting and election-administration patterns come from the MIT Election Lab's Survey of the Performance of American Elections. Block-group crime detail comes from CrimeGrade. Internet data and modeling support provided by ISPreports.org.
Modeling and analysis by the BestNeighborhood data science team. Full methodology and findings: political spectrum map.
Methodology reviewed by the BestNeighborhood data team. Last updated May 2026.