North Willow Farms leans heavily Democratic by roughly 50 points: about 75% of voters vote Democratic and 25% Republican.
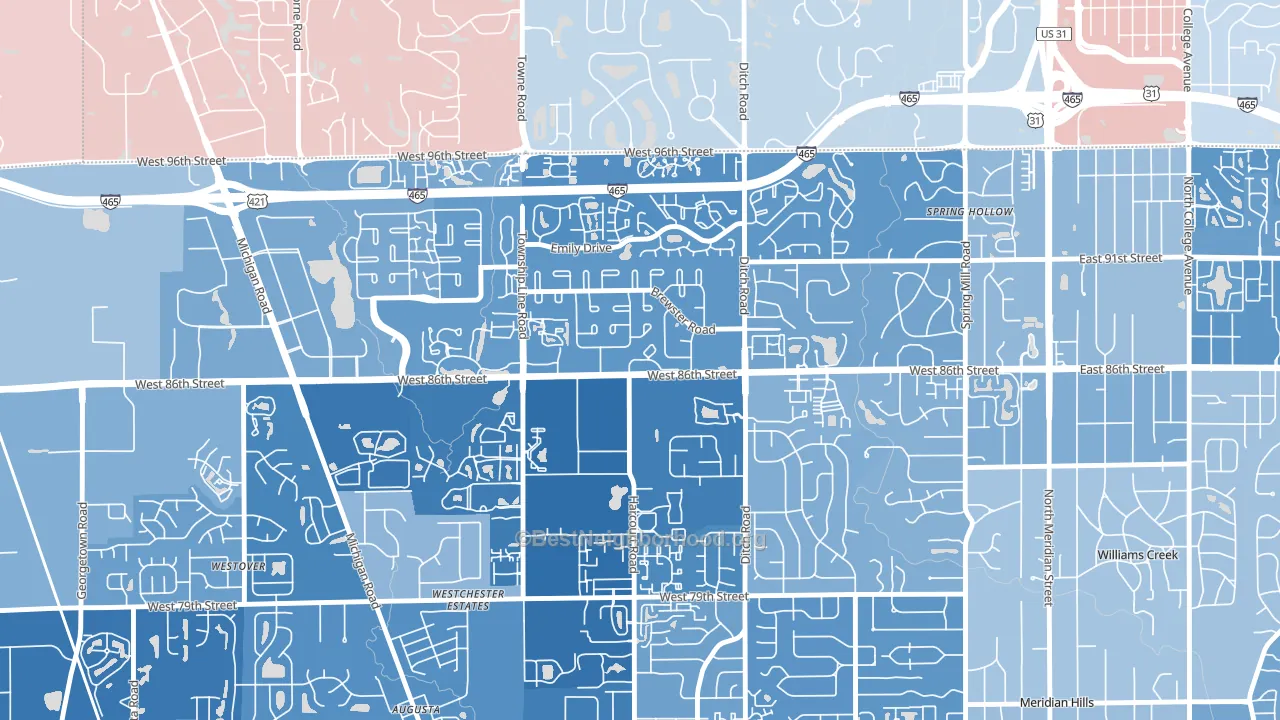
About 55% of adults in North Willow Farms typically vote, below the U.S. average of about 62%. Among adults in North Willow Farms, ~41% vote Democratic, ~14% Republican, and ~45% don't vote. The map below shows estimated turnout by block group.
How North Willow Farms compares
Among neighborhoods within 5 miles, North Willow Farms leans more Democratic than 2 of 3 neighbors.
North Willow Farms runs about 68 points more Democratic than Indiana as a whole. Indiana leans Republican overall, while North Willow Farms is one of the few Democratic-leaning pockets.
Politics vary noticeably by block within North Willow Farms. The south side is the most Democratic-leaning (D+59) and the west side is the least Democratic-leaning (D+40), a spread of about 19 points.
Why North Willow Farms leans the way it does
This analysis examined 14,881 data points per neighborhood to find what predicts political lean and turnout. The items below are a few correlations that stood out for North Willow Farms, not a ranked or complete list of what matters most.
North Willow Farms votes against the grain of Indiana. Indiana leans Republican overall, while North Willow Farms runs about 68 points more Democratic.
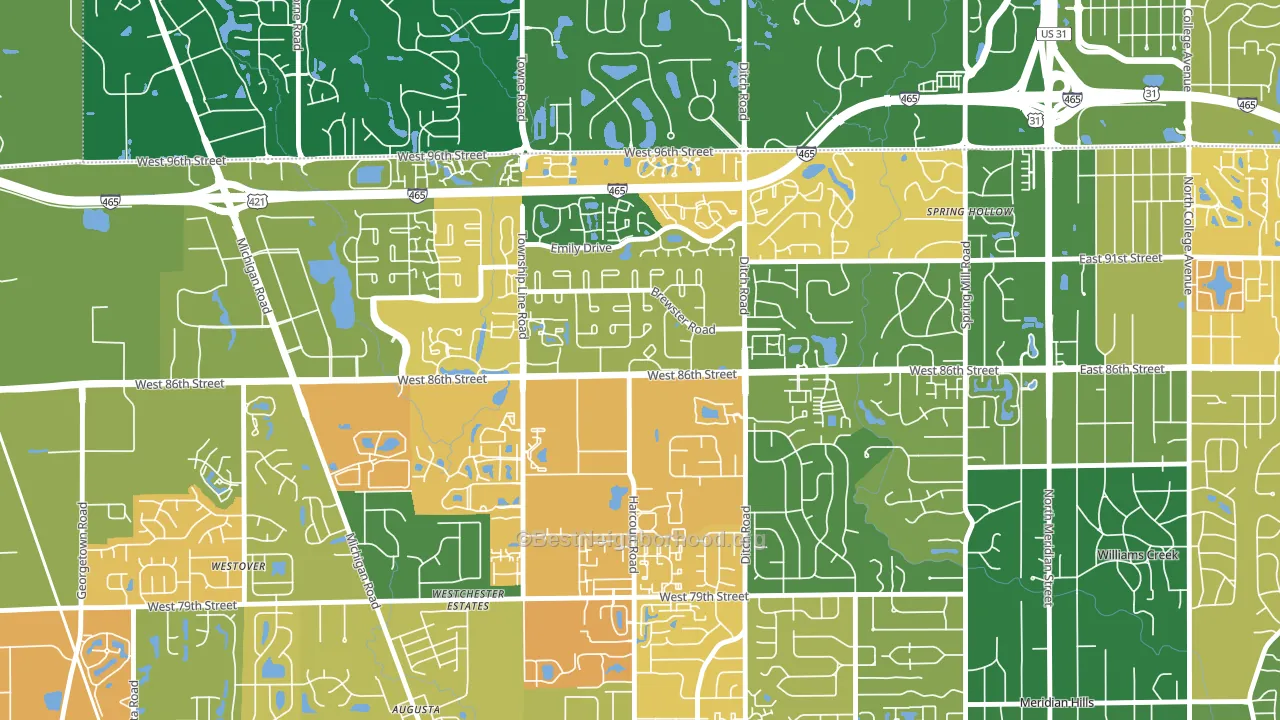
Park access and Republican lean
Places with low park coverage tend to lean Republican; North Willow Farms, Indianapolis, IN sits in the bottom tenth nationally on this measure. Park access does not change how people vote; it tends to track denser, higher-income areas.
Why turnout in North Willow Farms looks the way it does
Crowded housing lines up with lower turnout. About 7% of homes in North Willow Farms have more than one occupant per room, above 85% of neighborhoods. Learn more about the findings and methodology on the political spectrum map.
Nearby Neighborhoods
- Westchester Estates, Indianapolis, IN D+55
- Nora, Indianapolis, IN D+34
- Broad Ripple, Indianapolis, IN D+48
- Meridian-Kessler, Indianapolis, IN D+57
- Bayswater, Indianapolis, IN D+59
- Venerable Flackville, Indianapolis, IN D+70
- Castleton, Indianapolis, IN D+37
- Mapleton-Fall Creek, Indianapolis, IN D+73
- Hearth Stone, Indianapolis, IN D+36
- Highland Vicinity, Indianapolis, IN D+77
Neighborhoods with Similar Populations
- Cedar Ridge, Waco, TX R+7
- Everett, Lincoln, NE D+40
- Skybrook, Huntersville, NC D+7
- Hopkins Fitch Grant, Holly Hill, FL R+4
- Midvale Heights, Madison, WI D+76
- Abbot, Ann Arbor, MI D+60
- Tam O'shanter, Bellevue, WA D+44
- Canyon Park, Bothell, WA D+22
- Woodbridge at Monte Viejo, San Antonio, TX D+9
- Galindo, Austin, TX D+54
Sources and methodology
Precinct-level voting records used to fit the model come from Indiana Secretary of State, Elections, distributed by the Voting and Election Science Team. Demographic inputs come from the U.S. Census Bureau (ACS 5-year estimates and the 2020 Decennial Census). Health and environmental inputs come from the CDC (PLACES and the Environmental Justice Index). Land cover comes from the USGS and EPA. Election-day and lead-up weather come from PRISM 4km daily grids and the NOAA Global Historical Climatology Network. Mail-voting and election-administration patterns come from the MIT Election Lab's Survey of the Performance of American Elections. Block-group crime detail comes from CrimeGrade. Internet data and modeling support provided by ISPreports.org.
Modeling and analysis by the BestNeighborhood data science team. Full methodology and findings: political spectrum map.
Methodology reviewed by the BestNeighborhood data team. Last updated May 2026.