Benton Park West is a Democratic stronghold. About 87% of voters here vote Democratic and 13% Republican.
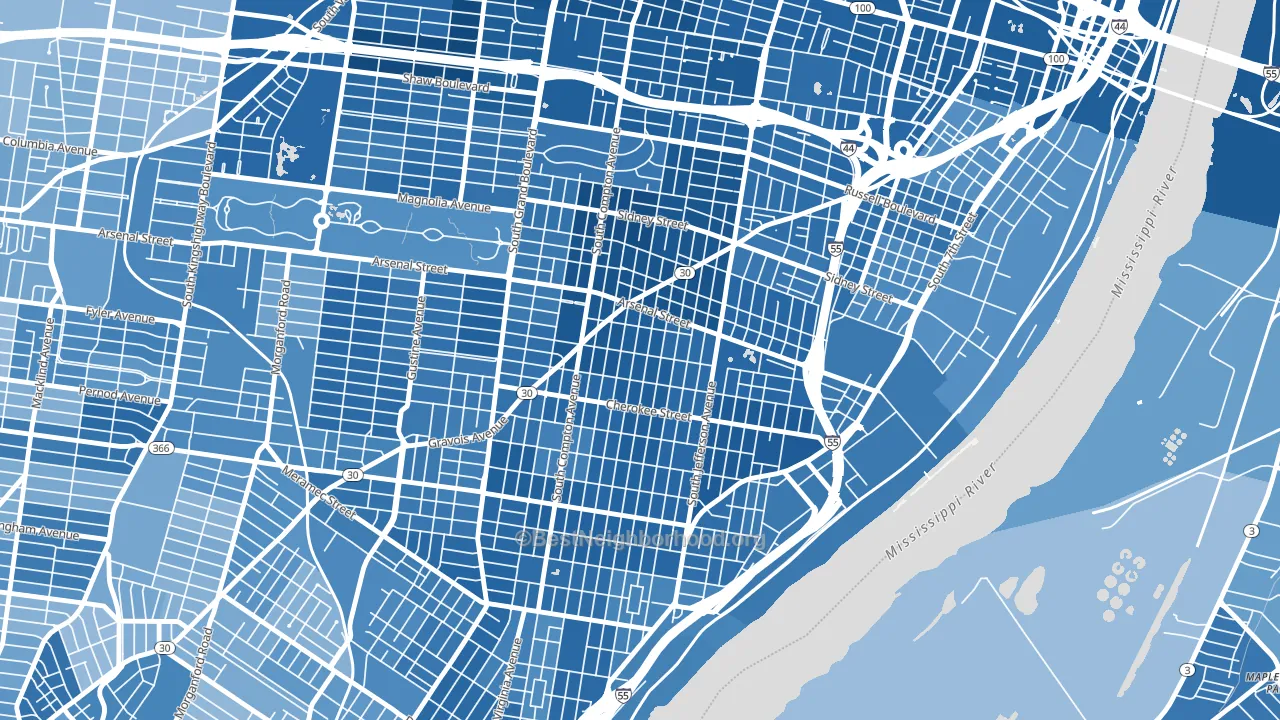
About 44% of adults in Benton Park West typically vote, below the U.S. average of about 62%. Among adults in Benton Park West, ~39% vote Democratic, ~6% Republican, and ~55% don't vote. The map below shows estimated turnout by block group.
How Benton Park West compares
Among neighborhoods within 5 miles, Benton Park West leans more Democratic than 22 of 30 neighbors.
Benton Park West runs about 92 points more Democratic than Missouri as a whole. Missouri leans Republican overall, while Benton Park West is one of the few Democratic-leaning pockets.
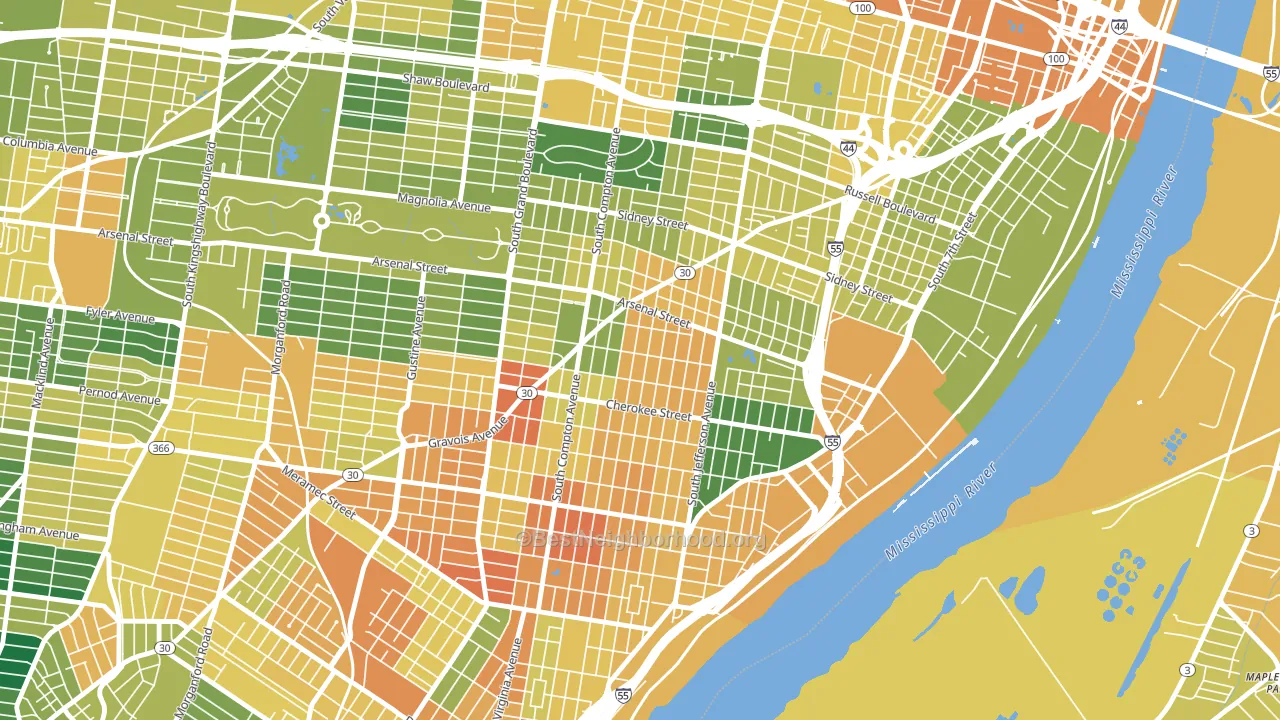
Politics vary noticeably by block within Benton Park West. The south side is the most Democratic-leaning (D+78) and the southwest side is the least Democratic-leaning (D+62), a spread of about 15 points.
Why Benton Park West leans the way it does
This analysis examined 14,881 data points per neighborhood to find what predicts political lean and turnout. The items below are a few correlations that stood out for Benton Park West, not a ranked or complete list of what matters most.
Dense areas vote Democratic. More than 99% of residents in Benton Park West live in densely developed areas, about 64 points above the U.S. average of 36%. A high never-married share predicts Democratic voting, and about 55% of adults in Benton Park West have never been married, above 89% of neighborhoods. Benton Park West runs against the grain of Missouri, a Democratic-leaning pocket in a Republican-leaning state.
Population density and Democratic lean
Places with high population density tend to lean Democratic; Benton Park West, St. Louis, MO sits in the top tenth nationally on this measure.
Why turnout in Benton Park West looks the way it does
Crowded housing lines up with lower turnout. About 9% of homes in Benton Park West have more than one occupant per room, above 89% of neighborhoods. High-crime urban areas turn out at lower rates, and Benton Park West sits in the top 15% on a violent-crime measure. Learn more about the findings and methodology on the political spectrum map.
Nearby Neighborhoods
- Gravois Park, St. Louis, MO D+72
- Tower Grove East, St. Louis, MO D+76
- Benton Park, St. Louis, MO D+74
- Tower Grove South, St. Louis, MO D+65
- Dutchtown, St. Louis, MO D+64
- Soulard, St. Louis, MO D+64
- Shaw, St. Louis, MO D+75
- The Gate District, St. Louis, MO D+75
- Mount Pleasant, St. Louis, MO D+61
- Bevo Mill, St. Louis, MO D+40
Neighborhoods with Similar Populations
- Kensington, Coral Springs, FL D+16
- North Hill, Springfield, OH D+14
- Biscayne, Jacksonville, FL D+59
- East Omaha, Omaha, NE D+22
- Windsor Hills, View Park-Windsor Hills, CA D+84
- Cooper, Minneapolis, MN D+76
- Uptown, Albuquerque, NM D+30
- Enfield Estates, Edinburg, TX R+2
- Stevens Square, Minneapolis, MN D+71
- Allwood, Clifton, NJ Even
Sources and methodology
Precinct-level voting records used to fit the model come from Missouri Secretary of State, Elections, distributed by the Voting and Election Science Team. Demographic inputs come from the U.S. Census Bureau (ACS 5-year estimates and the 2020 Decennial Census). Health and environmental inputs come from the CDC (PLACES and the Environmental Justice Index). Land cover comes from the USGS and EPA. Election-day and lead-up weather come from PRISM 4km daily grids and the NOAA Global Historical Climatology Network. Mail-voting and election-administration patterns come from the MIT Election Lab's Survey of the Performance of American Elections. Block-group crime detail comes from CrimeGrade. Internet data and modeling support provided by ISPreports.org.
Modeling and analysis by the BestNeighborhood data science team. Full methodology and findings: political spectrum map.
Methodology reviewed by the BestNeighborhood data team. Last updated May 2026.